Fig. 1
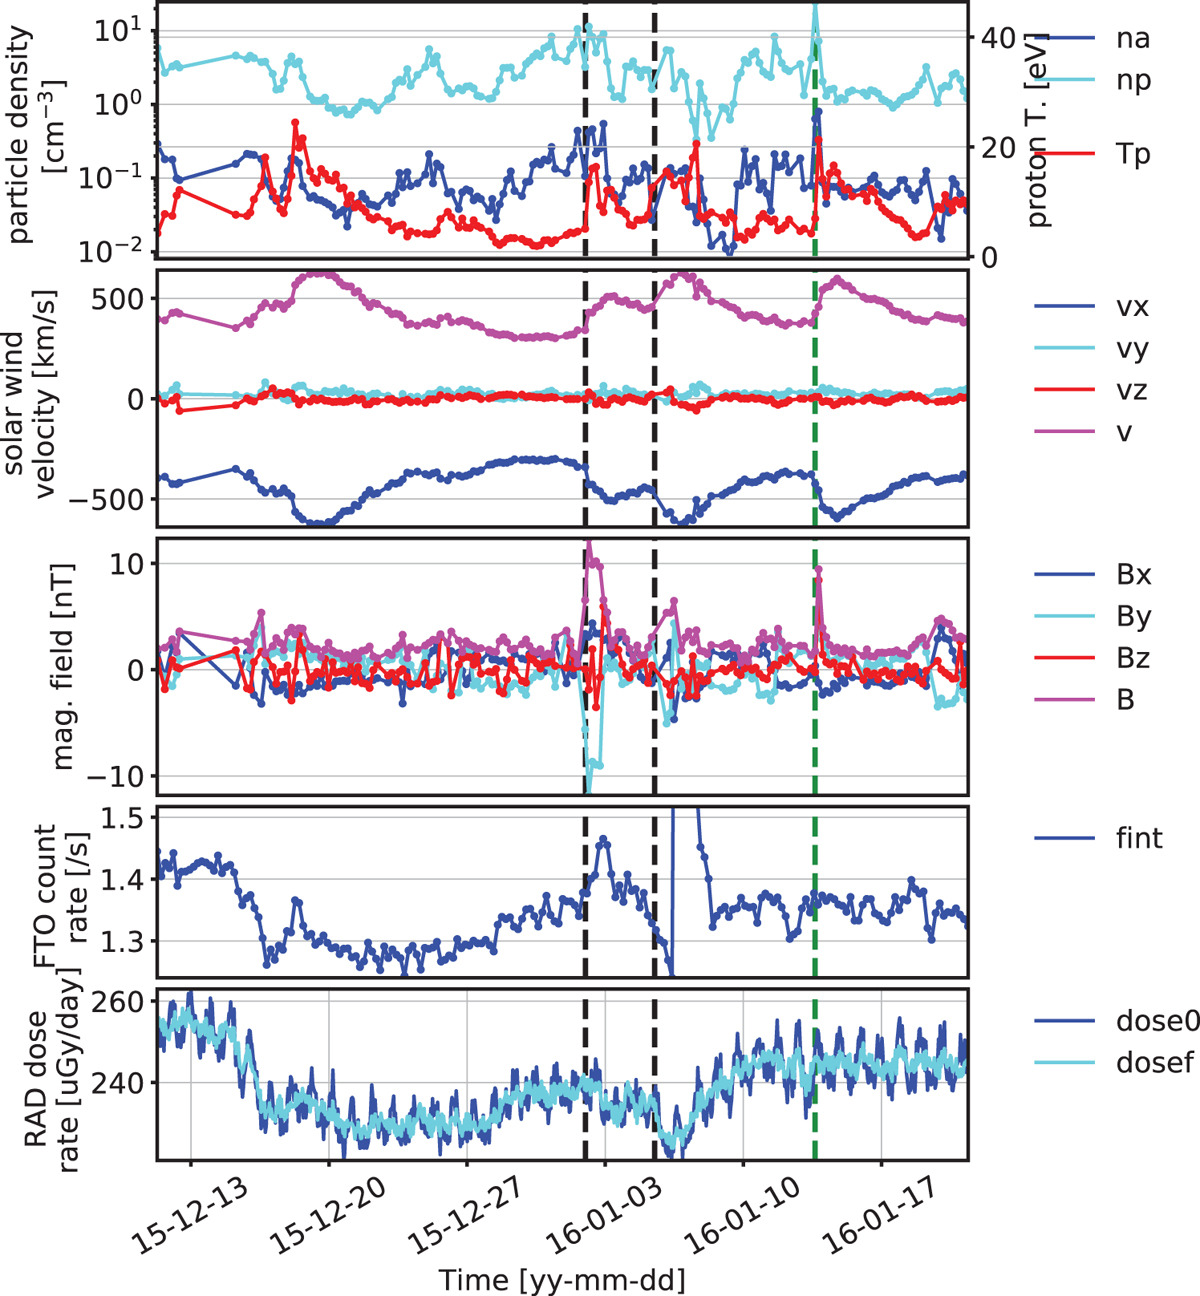
MAVEN and MSL/RAD measurement of several possible HSS, CME, FD, and SEP events at Mars from 2015-12-11 until 2016-01-21. The top two panels show the parameters measured by MAVEN/SWIA in the upstream solar wind region: proton temperature (Tp ), particle density of alphas (na) and protons (np), solar wind velocity (vx, vy and vz ) and its speed (v). The third panel shows the MAVEN/MAG measurement of IMF (Bx, By and Bz ) and its strength (B) in the upstream solar wind region. All vectors are in MSO coordinates. The next panel shows the integrated count rate “fint” approximately corresponding to protons ≥ 100 MeV in the MAVEN/SEP sensor 1 (averaged values of A and B sides). The last panel shows the dose rate measured by MSL/RAD on Martian surface with “dose0” standing for the original dose rate data while “dosef” for the filtered data using a notch filter to remove the variations at one sol frequency. Vertical lines denote the identified shocks with black and green lines for ICME- and SIR- related shocks respectively.
Current usage metrics show cumulative count of Article Views (full-text article views including HTML views, PDF and ePub downloads, according to the available data) and Abstracts Views on Vision4Press platform.
Data correspond to usage on the plateform after 2015. The current usage metrics is available 48-96 hours after online publication and is updated daily on week days.
Initial download of the metrics may take a while.