Fig. 7
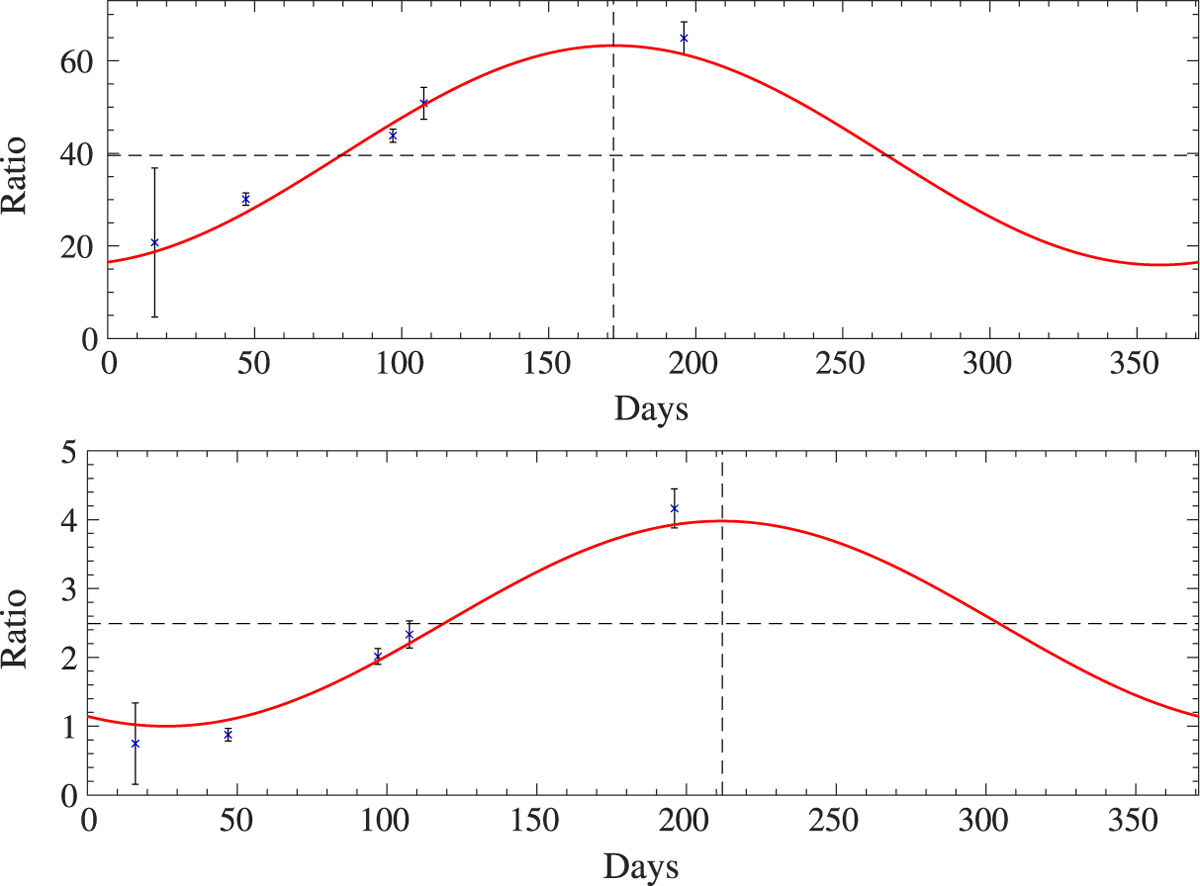
Observed light curves for R Scl (top) and the detached shell (bottom). The days are relative to June 1, 2016 (JD 2457540.5). The intensity of R Scl is reduced by a factor 1000 by the ND3 filter. The values of the ratio for the shell however were multiplied by a factor 1000 for the sake of readability. For both panels the errors were multiplied by five for visualisation. The dashed lines show the best-fit ratio and peak of the light curve for this period.
Current usage metrics show cumulative count of Article Views (full-text article views including HTML views, PDF and ePub downloads, according to the available data) and Abstracts Views on Vision4Press platform.
Data correspond to usage on the plateform after 2015. The current usage metrics is available 48-96 hours after online publication and is updated daily on week days.
Initial download of the metrics may take a while.