Fig. 1
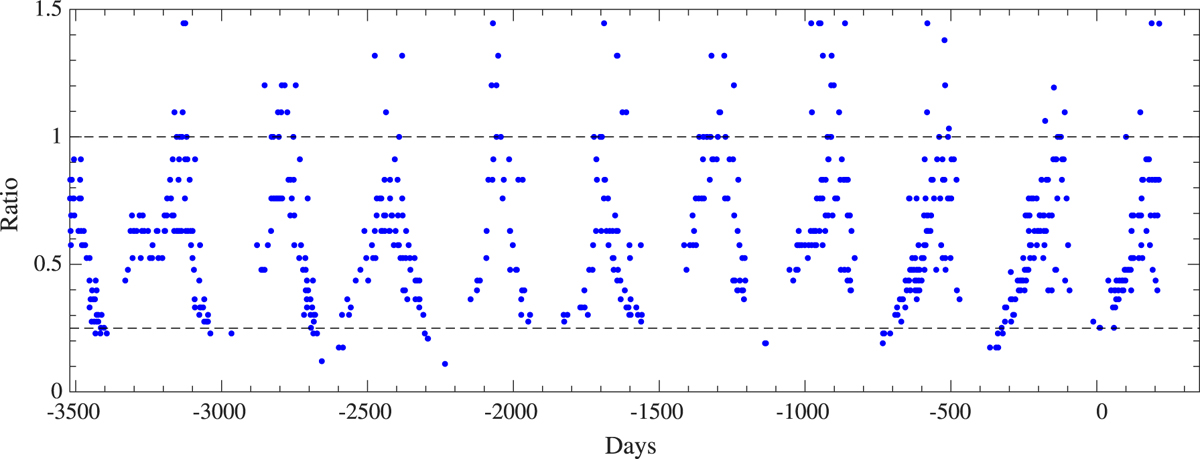
Light curve of R Scl based on V-band observations from AAVSO and relative to a magnitude of mV = 6.5 (i.e. ratio 1 in the figure). Observations are shown for the last ten years, relative to June 1st, 2016 (JD 2457540.5). The dashed lines indicate the minimum and maximum values corresponding to a min-to-max ratio of 0.25 (i.e. a magnitude amplitude of 0.75 magnitudes).
Current usage metrics show cumulative count of Article Views (full-text article views including HTML views, PDF and ePub downloads, according to the available data) and Abstracts Views on Vision4Press platform.
Data correspond to usage on the plateform after 2015. The current usage metrics is available 48-96 hours after online publication and is updated daily on week days.
Initial download of the metrics may take a while.