Free Access
Fig. 6
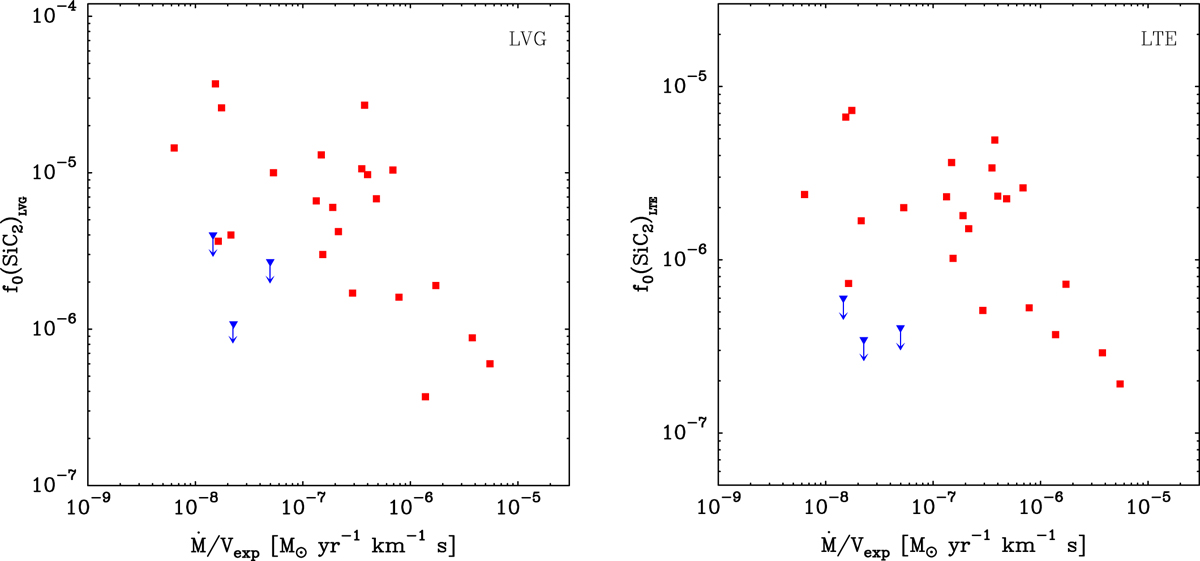
Fractional abundances of SiC2 (f0 ) derived with the LVG method (left panel) and assuming LTE excitation (right panel) vs. the envelope density proxy Ṁ ∕V exp for the 25 C-rich envelopes studied here. Blue downward triangles represent upper limits for f0 .
Current usage metrics show cumulative count of Article Views (full-text article views including HTML views, PDF and ePub downloads, according to the available data) and Abstracts Views on Vision4Press platform.
Data correspond to usage on the plateform after 2015. The current usage metrics is available 48-96 hours after online publication and is updated daily on week days.
Initial download of the metrics may take a while.