Free Access
Fig. 4
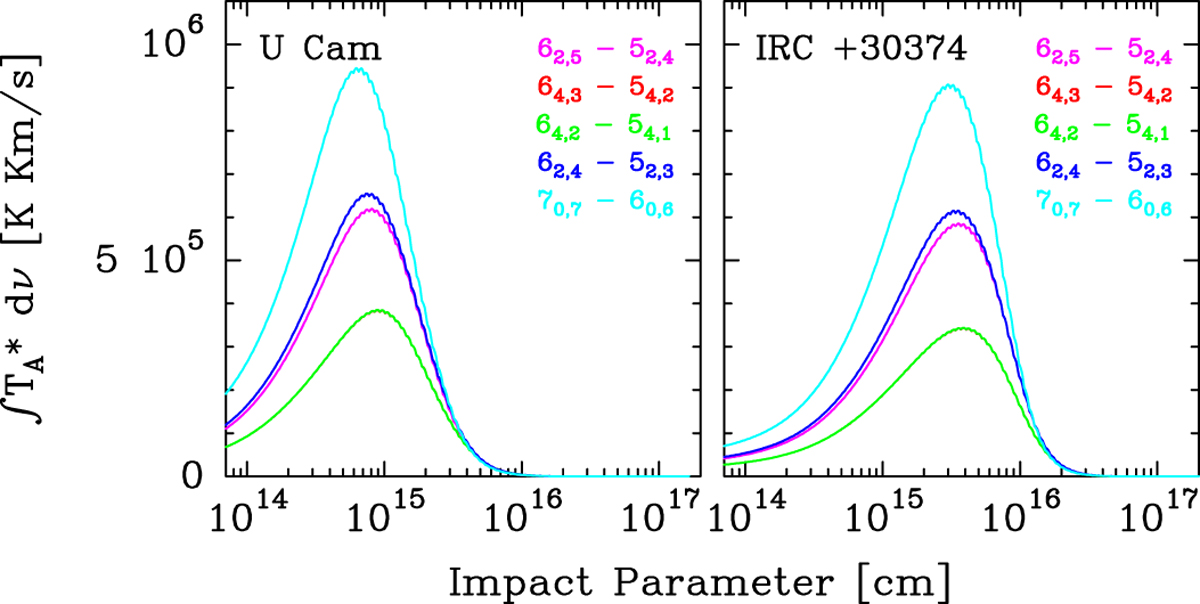
Velocity-integrated intensity plotted as a function of impact parameter for the five observed SiC2 lines in U Cam and IRC +30374. The transitions 64,3 − 54,2 and 64,2 −54,1 have overlapping curves. For visualization reasons, the intensities of U Cam are multipled by a factor of 2.75.
Current usage metrics show cumulative count of Article Views (full-text article views including HTML views, PDF and ePub downloads, according to the available data) and Abstracts Views on Vision4Press platform.
Data correspond to usage on the plateform after 2015. The current usage metrics is available 48-96 hours after online publication and is updated daily on week days.
Initial download of the metrics may take a while.