Free Access
Fig. 5
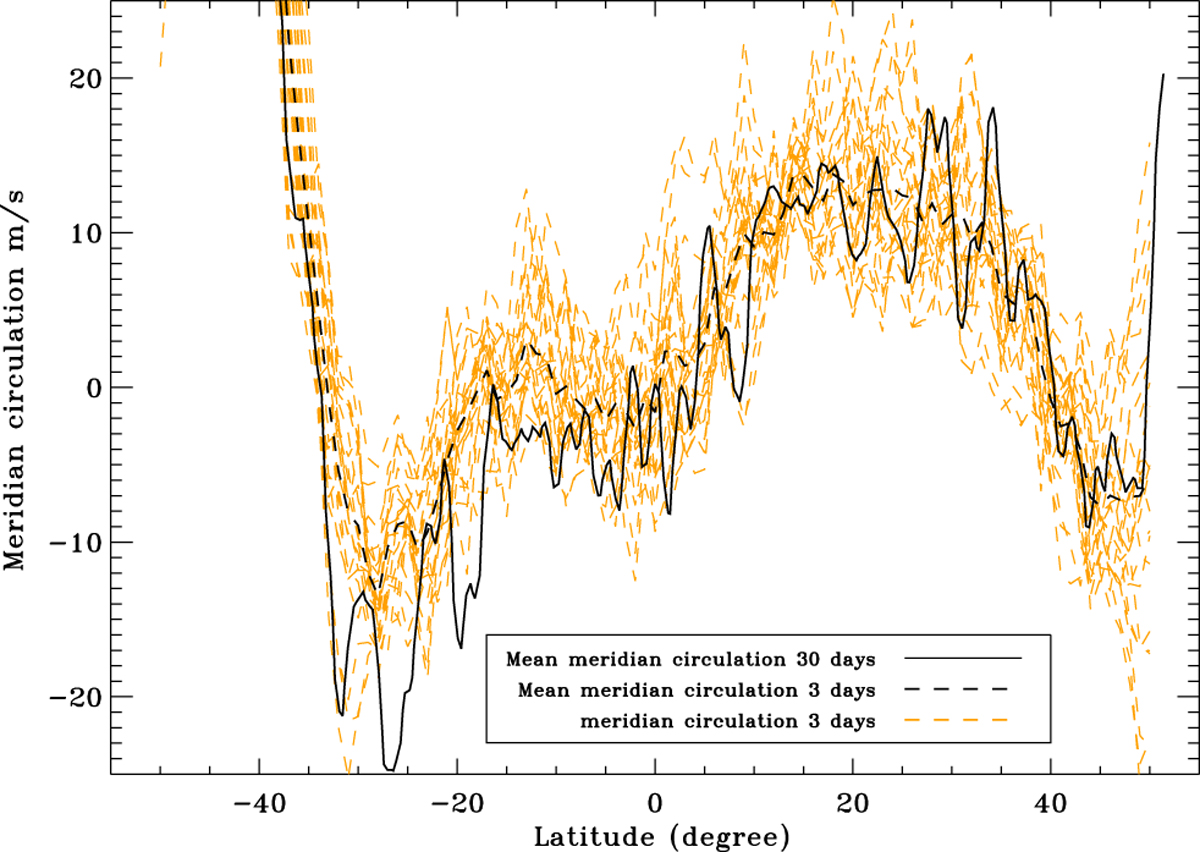
Meridional circulation measured with a moving temporal window of 3 days during the 30-day sequence (orange dashed line), meridional circulation issued from the temporal averaging of 30 days (solid line) and the average of all the 3-day averages (dashed lines).
Current usage metrics show cumulative count of Article Views (full-text article views including HTML views, PDF and ePub downloads, according to the available data) and Abstracts Views on Vision4Press platform.
Data correspond to usage on the plateform after 2015. The current usage metrics is available 48-96 hours after online publication and is updated daily on week days.
Initial download of the metrics may take a while.