Free Access
Table 1
Selected bands of acetaldehyde, ethanol, and dimethyl ether.
| Species | Formula | Mode | Peak position* | A′ | |||
|---|---|---|---|---|---|---|---|
| cm−1 | μm | cm mol−1 | |||||
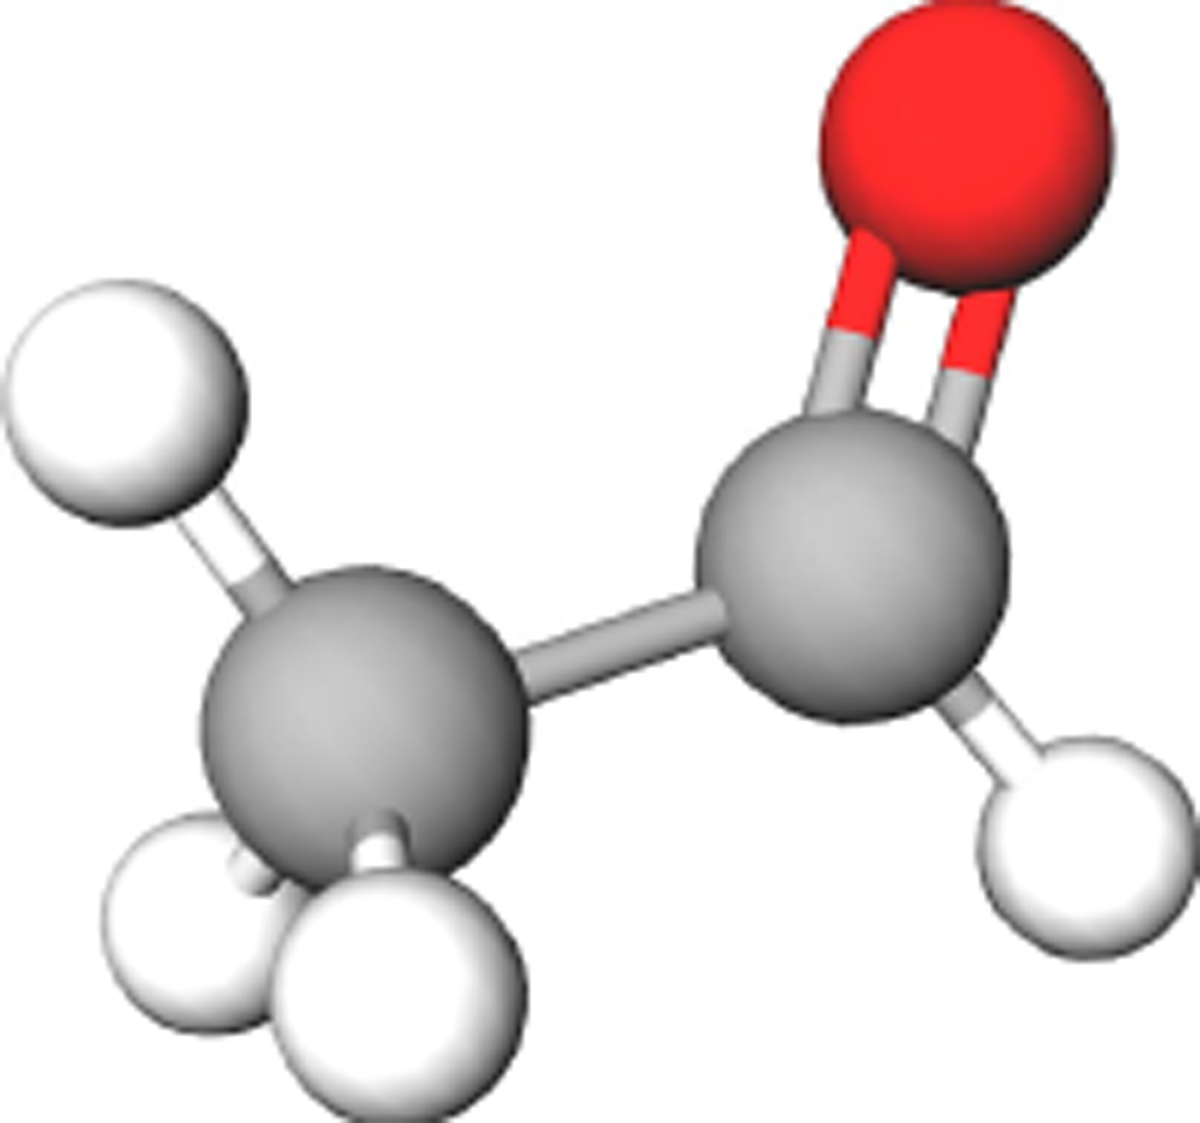 | Acetaldehyde | CH3CHO | CH3 rock. + CC stretch. | 1122.3 | 8.909 | ||
| + CCO bend. | |||||||
| CH3 s-deform. + CH wag. | 1346.2 | 7.427 | |||||
| CH3 deform. | 1429.4 | 6.995 | |||||
| CO stretch. | 1723.0 | 5.803 | 1.3 × 10⁻¹⁷ a | ||||
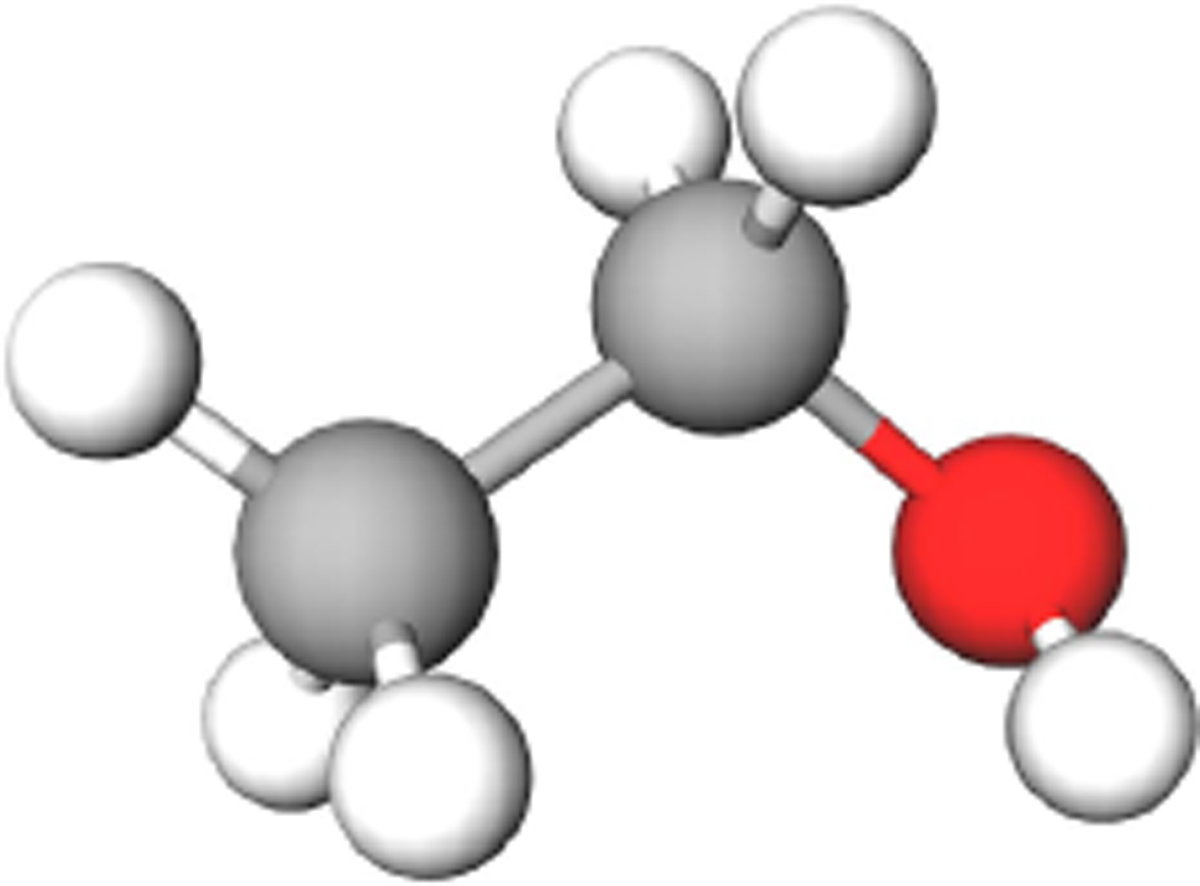 | Ethanol | CH3CH2OH | CC stretch. | 879.8 | 11.36 | 3.24 × 10⁻¹⁸ b | |
| CO stretch. | 1051.0 | 9.514 | 1.41 × 10⁻¹⁷ b | ||||
| CH3 rock. | 1090.5 | 9.170 | 7.35 × 10⁻¹⁸ b | ||||
| CH2 tors. | 1275.2 | 7.842 | |||||
| OH deform. | 1330.2 | 7.518 | |||||
| CH3 s-deform. | 1381.3 | 7.240 | |||||
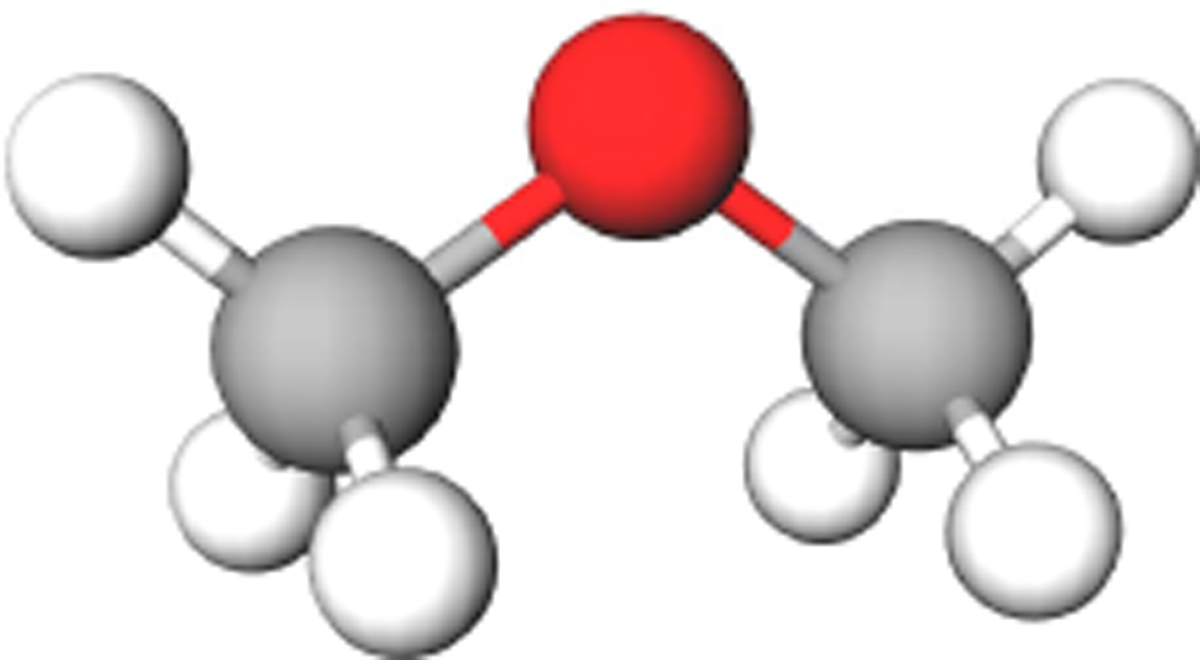 | Dimethyl ether | CH3OCH3 | COC stretch. | 921.3 | 10.85 | 5.0 × 10⁻¹⁸ c | |
| COC stretch. + CH3 rock. | 1093.9 | 9.141 | 9.2 × 10⁻¹⁸ c | ||||
| COC stretch. + CH3 rock. | 1163.8 | 8.592 | 9.8 × 10⁻¹⁸ c | ||||
| CH3 rock. | 1248.2 | 8.011 | |||||
Notes. (*) Peak position of the pure molecule at 15 K. Note that throughout literature there seems to be disagreement in the assignment of certain modes, particularly for ethanol. References. (a) Schutte et al. (1999). (b) Hudson (2017). (c) This work.
Current usage metrics show cumulative count of Article Views (full-text article views including HTML views, PDF and ePub downloads, according to the available data) and Abstracts Views on Vision4Press platform.
Data correspond to usage on the plateform after 2015. The current usage metrics is available 48-96 hours after online publication and is updated daily on week days.
Initial download of the metrics may take a while.