Fig. A.1
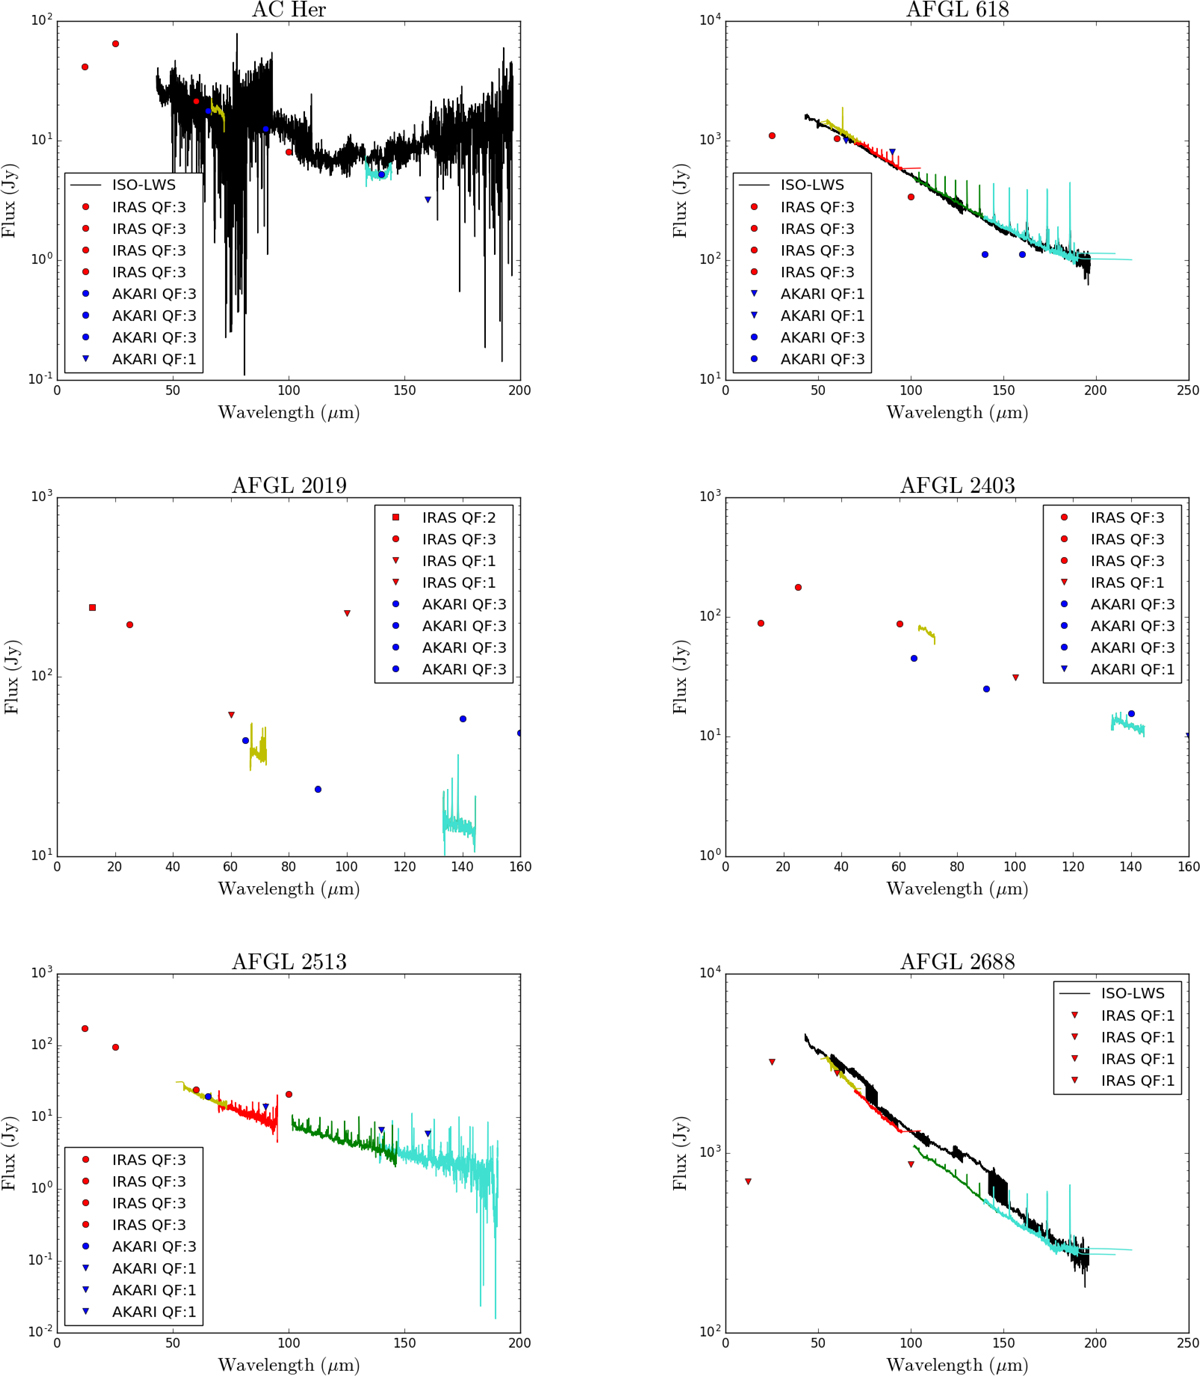
PACS spectroscopy SED of well-pointed, non-extended sources, after applying PSFLC and semi-extended 3 × 3 correction (PSFLC-3 × 3). PACS data is colour-coded according to the spectral region covered by each subrange, as follows: ~50−70 μm (yellow), ~70–100 μm (red), ~100−145 μm (green), and ~145−200 μm (turquoise). IRAS (red points) and AKARI (blue points) photometric data and ISO (black) spectroscopic data are also displayed when available. We do not show those observations pointed to a specific region in the case of very extended sources suchas rims or knots.
Current usage metrics show cumulative count of Article Views (full-text article views including HTML views, PDF and ePub downloads, according to the available data) and Abstracts Views on Vision4Press platform.
Data correspond to usage on the plateform after 2015. The current usage metrics is available 48-96 hours after online publication and is updated daily on week days.
Initial download of the metrics may take a while.