Fig. 7
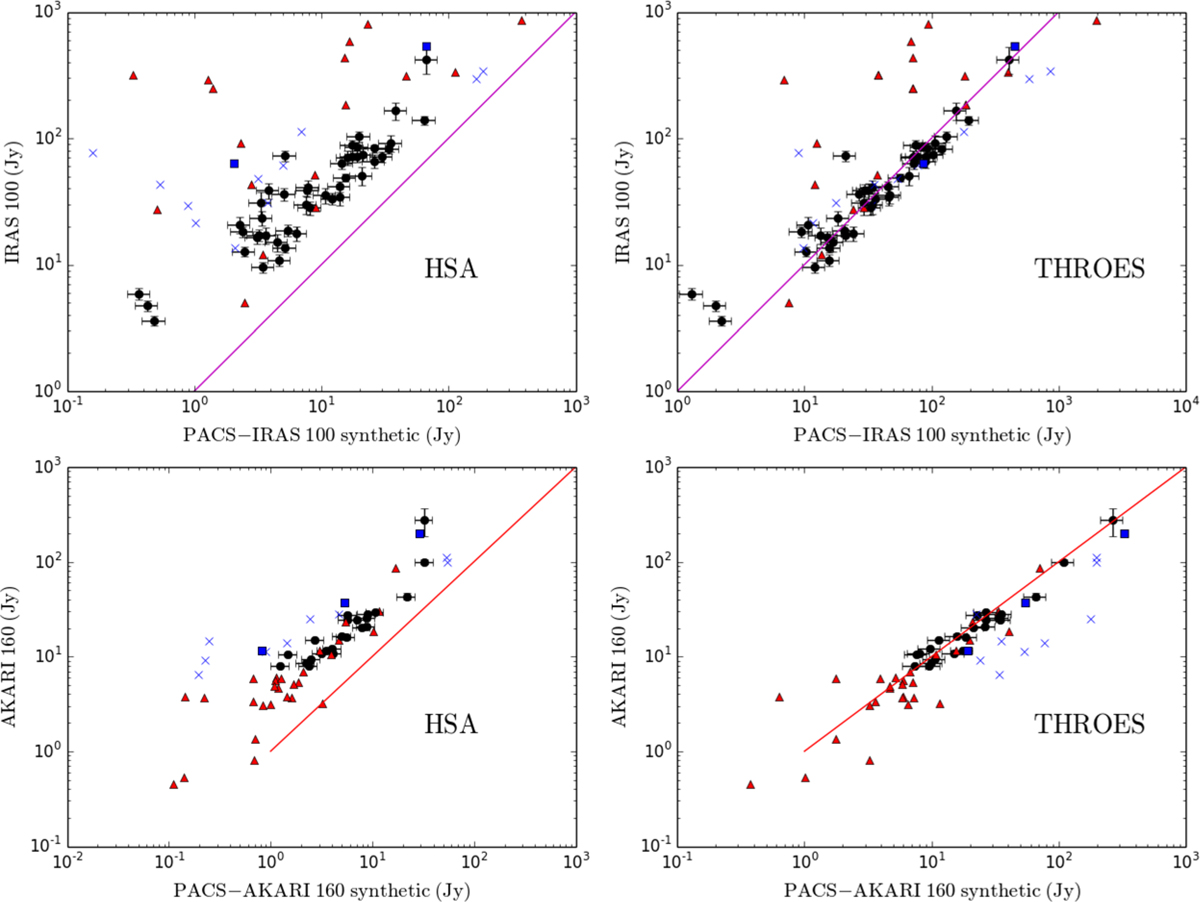
Comparison of IRAS (100 μm) and AKARI (160 μm) photometrywith synthetic PACS photometry at these wavelengths before (left) and after (right) the interactive reprocessing of the data carried out in this work and that is available through the THROES catalogue. The objects plotted here are those which present a complete coverage of the PACS spectral range. We have established a code to distinguish the extended objects (blue crosses), the mispointed ones (red squares), the objects with bad IRAS100 or AKARI160 data (Quality Flag ≠ 3, red triangles), and objects with good IRAS100 or AKARI160 data (Quality Flag = 3, black circles with error bars). The solid line represents a perfect match (1:1 ratio) of the synthetic (PACS) and observational photometric (IRAS and AKARI) points.
Current usage metrics show cumulative count of Article Views (full-text article views including HTML views, PDF and ePub downloads, according to the available data) and Abstracts Views on Vision4Press platform.
Data correspond to usage on the plateform after 2015. The current usage metrics is available 48-96 hours after online publication and is updated daily on week days.
Initial download of the metrics may take a while.