Fig. 9
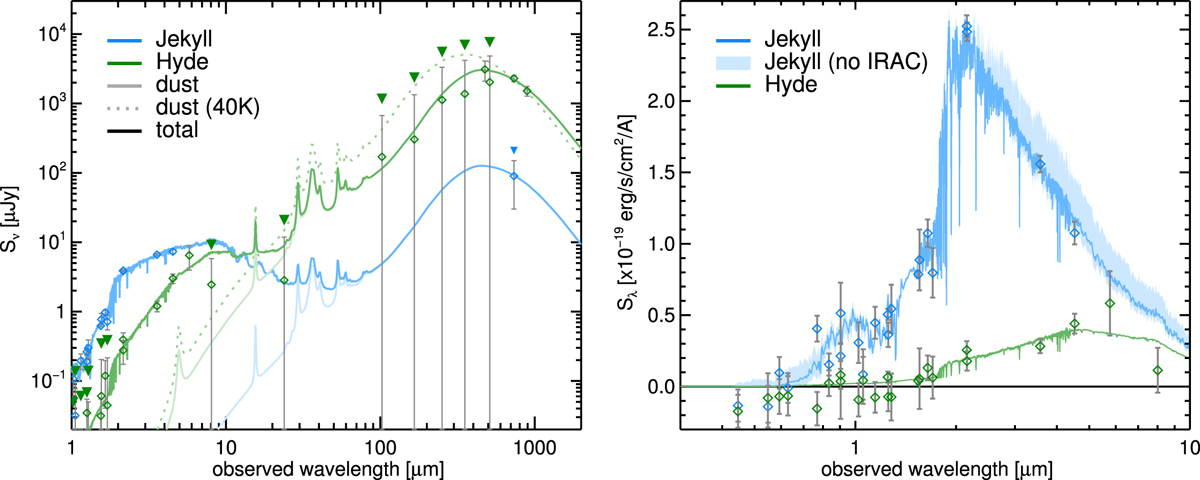
Left: photometry of Jekyll (blue) and Hyde (green) from the UV to the sub-millimeter. The observed photometry is shown with diamonds(downward pointing triangles indicate 2σ upper limits for measurements of significance less than 2σ). The bestfitting dust model is shown with an pale line,and the total model (dust and stars) is shown with a darker line. For illustration, for Hyde we also show a dust model assuming Tdust = 40 K, which overpredicts the MIPS, Herschel and SCUBA fluxes. The dust model for Jekyll is only illustrative, and was simply normalized to match the constraint from the 744 μm flux. Right: zoom-in on the stellar emission, shown in Sλ instead of Sν. As described in the text, the 5.8 and 8 μm photometry are shown here only for Hyde; the fluxes in these bands were obtained from aperture photometry of the whole system, with the predicted contribution of Jekyll subtracted. Here we also show in light blue the range of possible SEDs for Jekyll when all the IRAC photometry is ignored in the fit.
Current usage metrics show cumulative count of Article Views (full-text article views including HTML views, PDF and ePub downloads, according to the available data) and Abstracts Views on Vision4Press platform.
Data correspond to usage on the plateform after 2015. The current usage metrics is available 48-96 hours after online publication and is updated daily on week days.
Initial download of the metrics may take a while.