Fig. 8

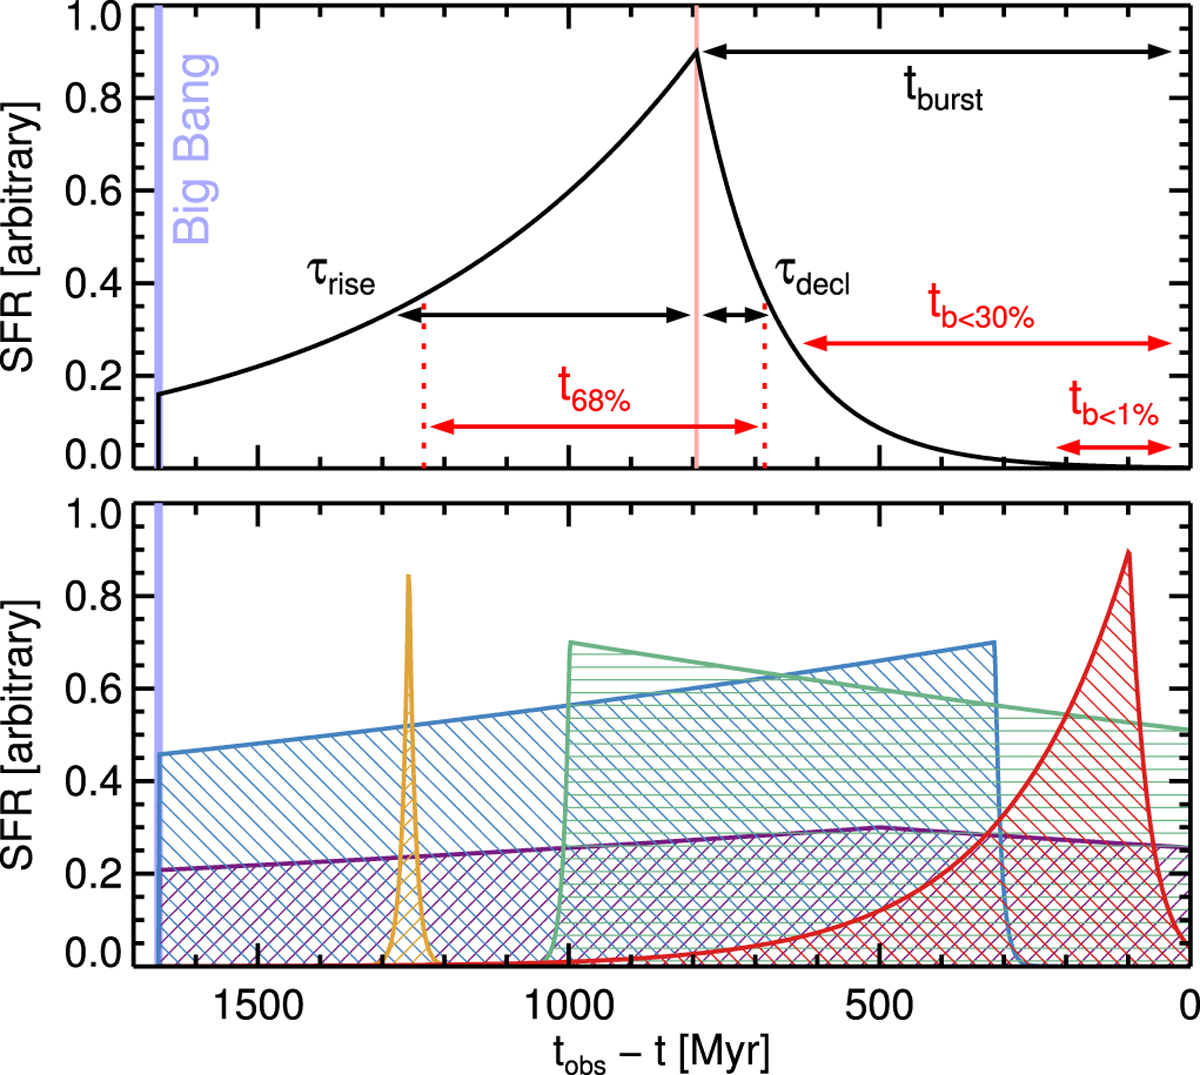
Cartoon picture (top) and examples (bottom) of our model SFH, displayed as the SFR as a functionof tobs − t where tobs is the time of observation (z ~ 3.7). In the top row, we show the parameters of the model SFH in black, and the post-processed quantities in red. The examples shown in the bottom row are a roughly constant SFH since the Big Bang (purple), a roughly constant SFH starting 1 Gyr ago (green), a roughly constant SFH with an abrupt quenching 300 Myr ago (blue), a brief and old burst (yellow), and a slowly rising SFH with a recent decline (red). Many more combinations are possible but not shown for clarity.
Current usage metrics show cumulative count of Article Views (full-text article views including HTML views, PDF and ePub downloads, according to the available data) and Abstracts Views on Vision4Press platform.
Data correspond to usage on the plateform after 2015. The current usage metrics is available 48-96 hours after online publication and is updated daily on week days.
Initial download of the metrics may take a while.


