Free Access
Fig. 5
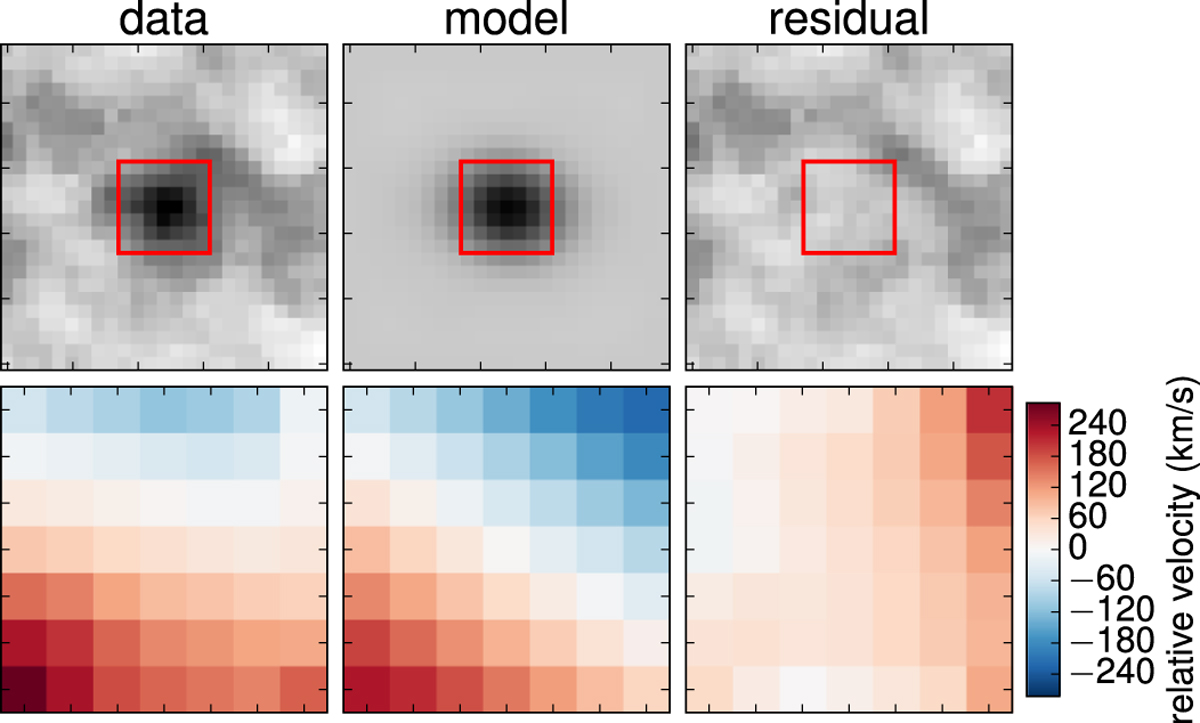
Result of the modeling of the [C II] line emission with a rotating disk model. The first row shows the spectrally-integrated line intensity map, and the second row is the velocity field in the central region (indicated with a red box in the first row, 0.6′′ × 0.6′′). The beam FWHM is 0.52 × 0.42′′.
Current usage metrics show cumulative count of Article Views (full-text article views including HTML views, PDF and ePub downloads, according to the available data) and Abstracts Views on Vision4Press platform.
Data correspond to usage on the plateform after 2015. The current usage metrics is available 48-96 hours after online publication and is updated daily on week days.
Initial download of the metrics may take a while.