Fig. 4
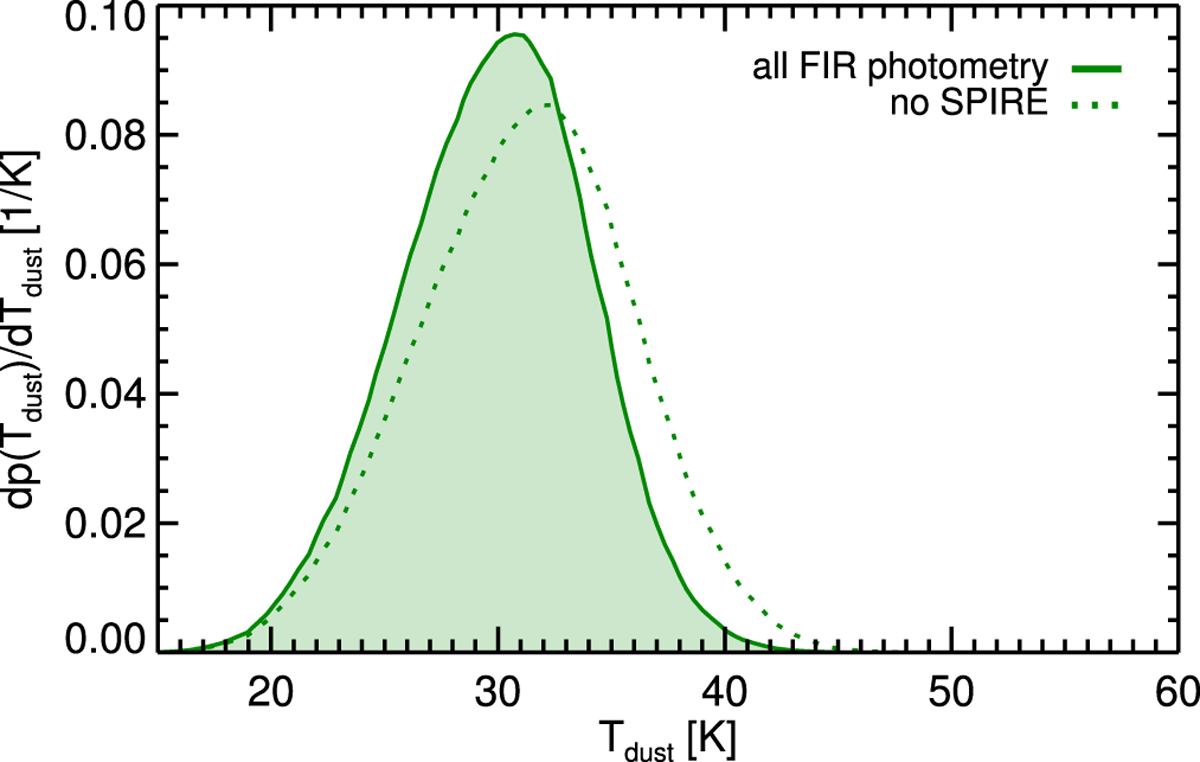
Probability distribution of the dust temperature (Tdust) for Hyde. This was derived from the χ2 of a grid of Tdust values tested against the observed photometry. The solid line shows the distribution using all the FIR photometry, and the dotted line shows how the distribution would have changed if we had not used the Herschel SPIRE photometry.
Current usage metrics show cumulative count of Article Views (full-text article views including HTML views, PDF and ePub downloads, according to the available data) and Abstracts Views on Vision4Press platform.
Data correspond to usage on the plateform after 2015. The current usage metrics is available 48-96 hours after online publication and is updated daily on week days.
Initial download of the metrics may take a while.