Fig. 2
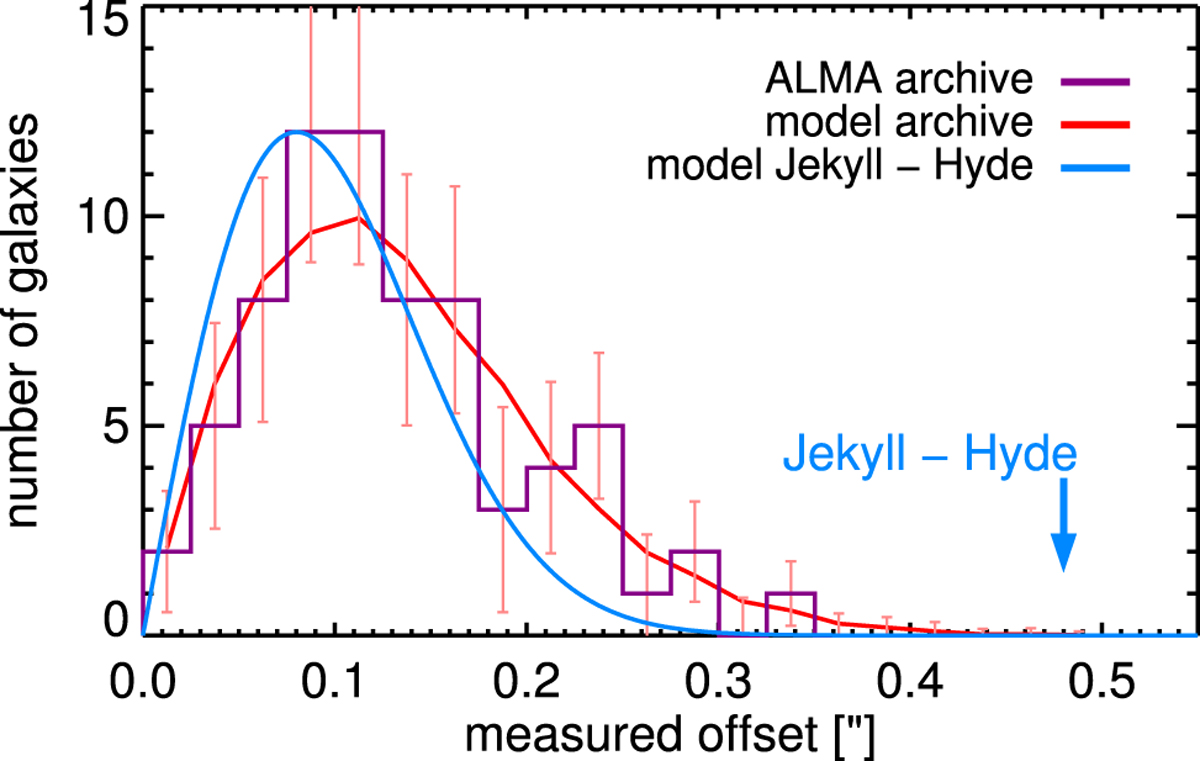
Distribution of observed positional offsets between ALMA and VISTA in the COSMOS field. The purple histogram shows the observed distribution for 76 galaxies selected from the ALMA archive, and the red line is the best-fit model (including telescope pointing accuracy and uncertainty in the centroid determination on noisy images). Error bars show counting uncertainties derived assuming Poisson statistics from the best-fit model. The blue arrow shows the offset observed between Jekyll and Hyde, and the blue line is the expected offset distribution given the S/N and PSF width of the two galaxies on their respective images.
Current usage metrics show cumulative count of Article Views (full-text article views including HTML views, PDF and ePub downloads, according to the available data) and Abstracts Views on Vision4Press platform.
Data correspond to usage on the plateform after 2015. The current usage metrics is available 48-96 hours after online publication and is updated daily on week days.
Initial download of the metrics may take a while.