Fig. A.1
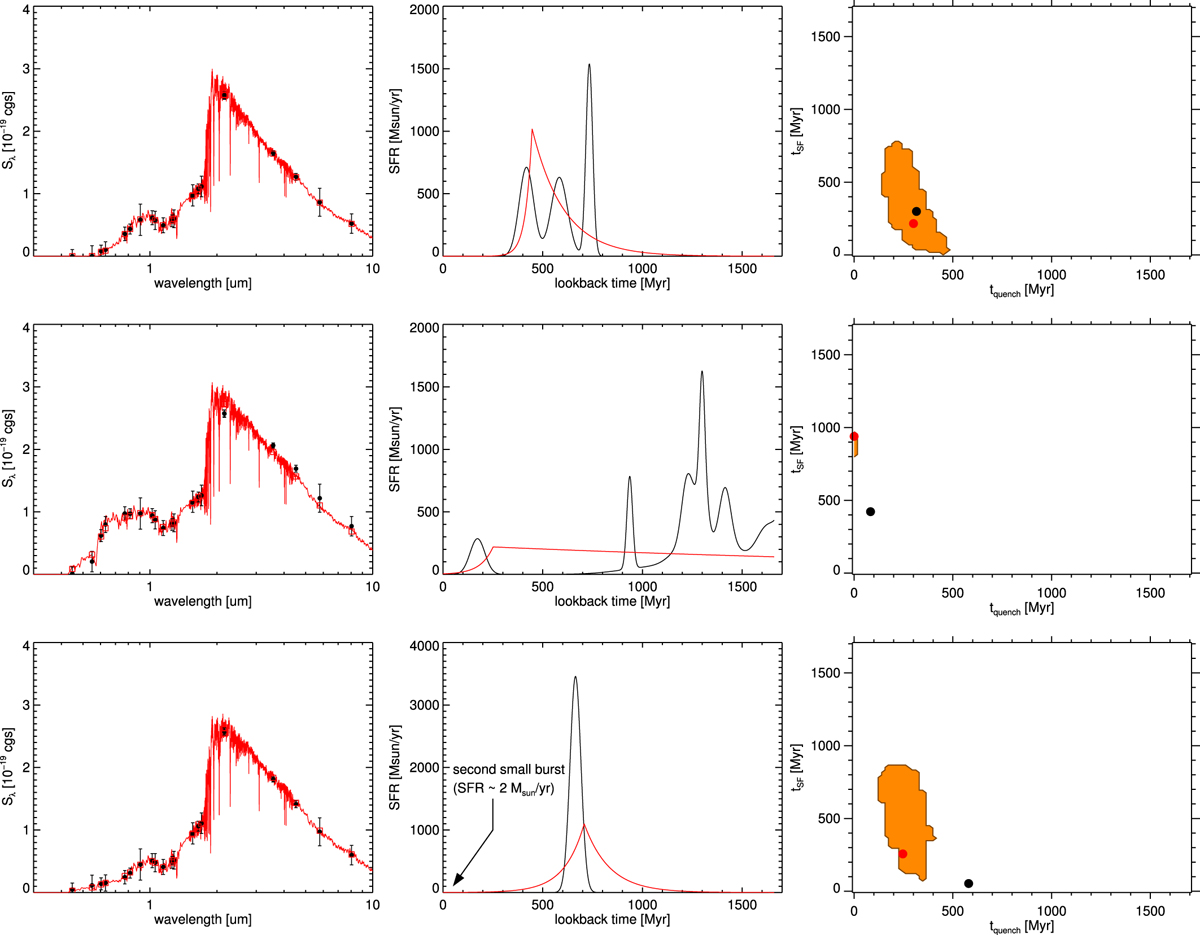
Simulated SFHs for comparison with Jekyll. The first row shows a quenched SFH composed of three bursts. The second row shows an SFH where most of the mass was formed very early, and a small burst happened 200 Myr before observation, creating the post-starburst features. The third row shows an SFH with two burst, the last one happening when the galaxy is observed but has a very small SFR . Left: synthetic photometry for the complex SFH (black points) and best-fit model from FAST++ (red line and red squares). Middle: complex SFH (black) and best-fit model (red). Right: constraints on the formation and quenching timescales (t68% and tb<1%) given by themodel (orange area), best-fit value (red circle) and true value (black circle).
Current usage metrics show cumulative count of Article Views (full-text article views including HTML views, PDF and ePub downloads, according to the available data) and Abstracts Views on Vision4Press platform.
Data correspond to usage on the plateform after 2015. The current usage metrics is available 48-96 hours after online publication and is updated daily on week days.
Initial download of the metrics may take a while.