Fig. 14
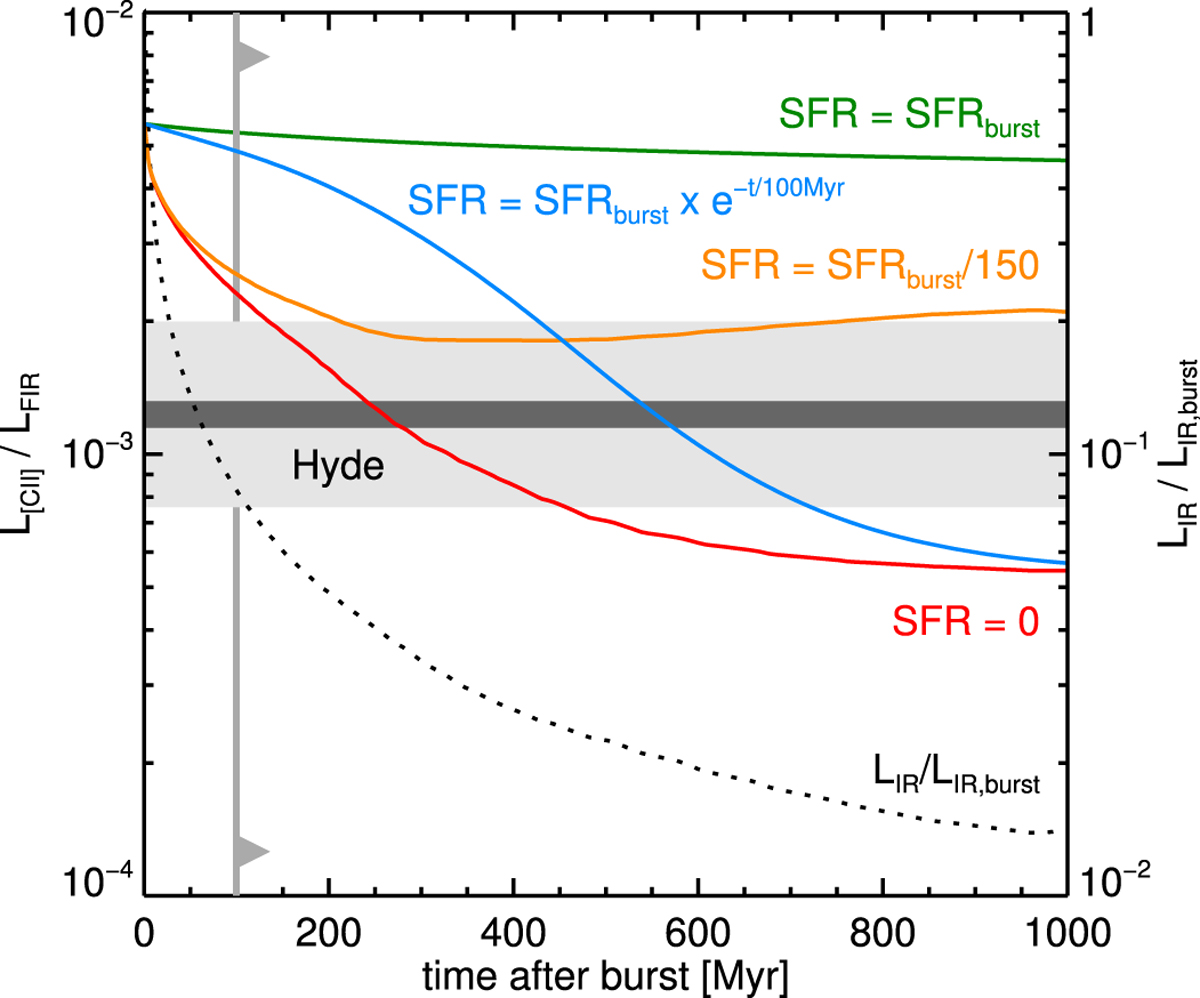
Ratio of the luminosity of the [C II] line (L[C II ]) to the FIR luminosity (LFIR, 42.5–122.5 μm) producedby a composite stellar population, as predicted by the toy model described in the text.These values correspond to a stellar population created in a single burst from t = −100 to t = 0 Myr, and with varying amounts of residual star-formation after theburst. The red line shows the case where there is no residual star-formation, while the orange curve corresponds to a residual SFR 150 times lower than the SFR during the burst. The blue line corresponds to an exponentially declining SFR after the burst, with timescale 100 Myr . The green line shows the case of constant star-formation for reference (i.e., no end to the burst). The [C II] deficit ofHyde and its error bar are indicated with a dark gray band and shaded region in the background. Lastly, the relative decrease of LIR with time in the case of no residual star-formation is shown with a dotted line.
Current usage metrics show cumulative count of Article Views (full-text article views including HTML views, PDF and ePub downloads, according to the available data) and Abstracts Views on Vision4Press platform.
Data correspond to usage on the plateform after 2015. The current usage metrics is available 48-96 hours after online publication and is updated daily on week days.
Initial download of the metrics may take a while.