Fig. 13
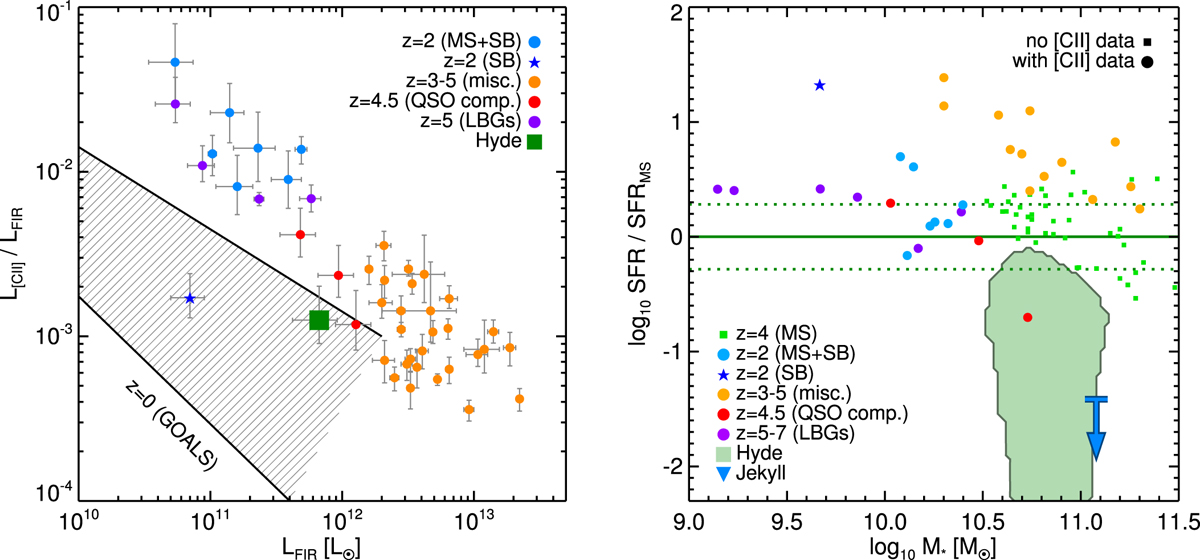
Left: relation between the
L[C II ] ∕LFIR
ratio and LFIR.
The values observed for Hyde are shown with
a green square. The range of values found in
z = 0
luminous infrared galaxies are indicated with
the hashed region (Díaz-Santos et al. 2013).
High-redshift galaxies from the literature are
shown with colored circles: light blue for the
z = 2
galaxies of Brisbin et al. (2015), dark blue for the lensed
z = 2
galaxy studied in Schaerer et al. (2015), red for the
z = 4.5
SMGs found near quasars in
Trakhtenbrot et al. (2017), purple for the
z = 5
LBGs of Capak et al. (2015), and
finally orange a collection of galaxies at
z = 3–5
(Cox et al. 2011; De Breuck et al. 2011; Valtchanov et al. 2011; Swinbank et al. 2012; Walter et al. 2012; Wagg et al. 2012; Riechers et al. 2013, 2014; Gullberg et al. 2015; Oteo et al. 2016). Galaxies from Brisbin et al.(2015)
and Gullberg et al.(2015) with unknown
magnification factors were assumed to have
μ = 10
(the average of the published magnifications
from both samples). When needed, we assumed
LFIR = LIR∕1.5.
Right: relation between the offset from the main sequence
(SFR ∕SFRMS)
and the stellar mass for the galaxies on the
left with measured masses. If no stellar mass
estimate was available, we inferred it from the
dynamical mass assuming a gas fraction of
50%.
The value of SFRMS
was taken from Schreiber et al. (2015) at
z < 3.5
and Schreiber et al. (2017) at
3.5 ≤ z ≤ 4.5;
values at higher redshifts were estimated
assuming a redshift dependence of
![]() .
On this plot, we also show with purple circles the two
z = 6.6
LBGs of Smit et al. (2018), which are detected in [C II]
but not in the FIR continuum, and thus for which the
SFR
is based only on the UV luminosity.
We also show the position of
z = 4
main sequence galaxies from Schreiber et al. (2017)
as small green squares; these galaxies have
no [C II] measurement. The 90% confidence
region for Hyde is shown in light green, and
the most conservative upper limit of Jekyll
(SFR < 13 M⊙
yr−1
at 3σ,
as obtained from SFRIR)
is shown with a blue arrow for reference.
.
On this plot, we also show with purple circles the two
z = 6.6
LBGs of Smit et al. (2018), which are detected in [C II]
but not in the FIR continuum, and thus for which the
SFR
is based only on the UV luminosity.
We also show the position of
z = 4
main sequence galaxies from Schreiber et al. (2017)
as small green squares; these galaxies have
no [C II] measurement. The 90% confidence
region for Hyde is shown in light green, and
the most conservative upper limit of Jekyll
(SFR < 13 M⊙
yr−1
at 3σ,
as obtained from SFRIR)
is shown with a blue arrow for reference.
Current usage metrics show cumulative count of Article Views (full-text article views including HTML views, PDF and ePub downloads, according to the available data) and Abstracts Views on Vision4Press platform.
Data correspond to usage on the plateform after 2015. The current usage metrics is available 48-96 hours after online publication and is updated daily on week days.
Initial download of the metrics may take a while.