Fig. 1
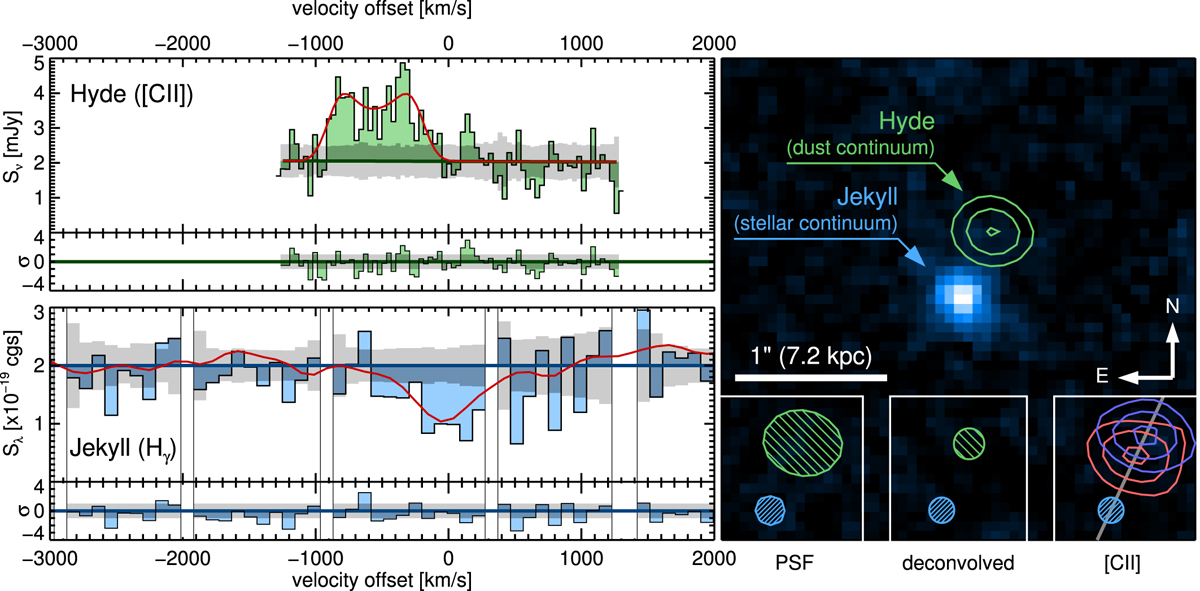
Spectra and imaging of Jekyll and Hyde. Top left: ALMA spectrum of Hyde. Bottom left: MOSFIRE spectrum of Jekyll (binned to 6.5 resolution).The two spectra are shown on the same velocity scale. The emission above and below the continuum level is shaded to emphasize the lines. The gray shaded area in the background is the 1σ flux uncertainty. We show the models best fitting these spectra with red lines. At the bottom of each plotwe give the normalized model residual σ, that is, the difference between observed and modeled flux divided by the uncertainty. Right: image of the Jekyll and Hyde system. The background image (blue tones; false colors) is the NIR H-band emission as observed by Hubble; the bright source at the center is Jekyll. We overlay the ALMA 740 μm continuum emission with green contours (the most extended contour corresponds half of the peak emission); the source detected here is Hyde. The full width at half maximum ofthe Hubble and ALMA point spread functions are given on the bottom left corner, followed to the right by the deconvolved profiles of the two galaxies (half-light area). Lastly, the inset on the bottom right corner shows the positionof the two velocity components of Hyde with respect to Jekyll (the blue contours correspond to the most blueshifted component), and a gray line connects the two galaxies.
Current usage metrics show cumulative count of Article Views (full-text article views including HTML views, PDF and ePub downloads, according to the available data) and Abstracts Views on Vision4Press platform.
Data correspond to usage on the plateform after 2015. The current usage metrics is available 48-96 hours after online publication and is updated daily on week days.
Initial download of the metrics may take a while.