Fig. A.1
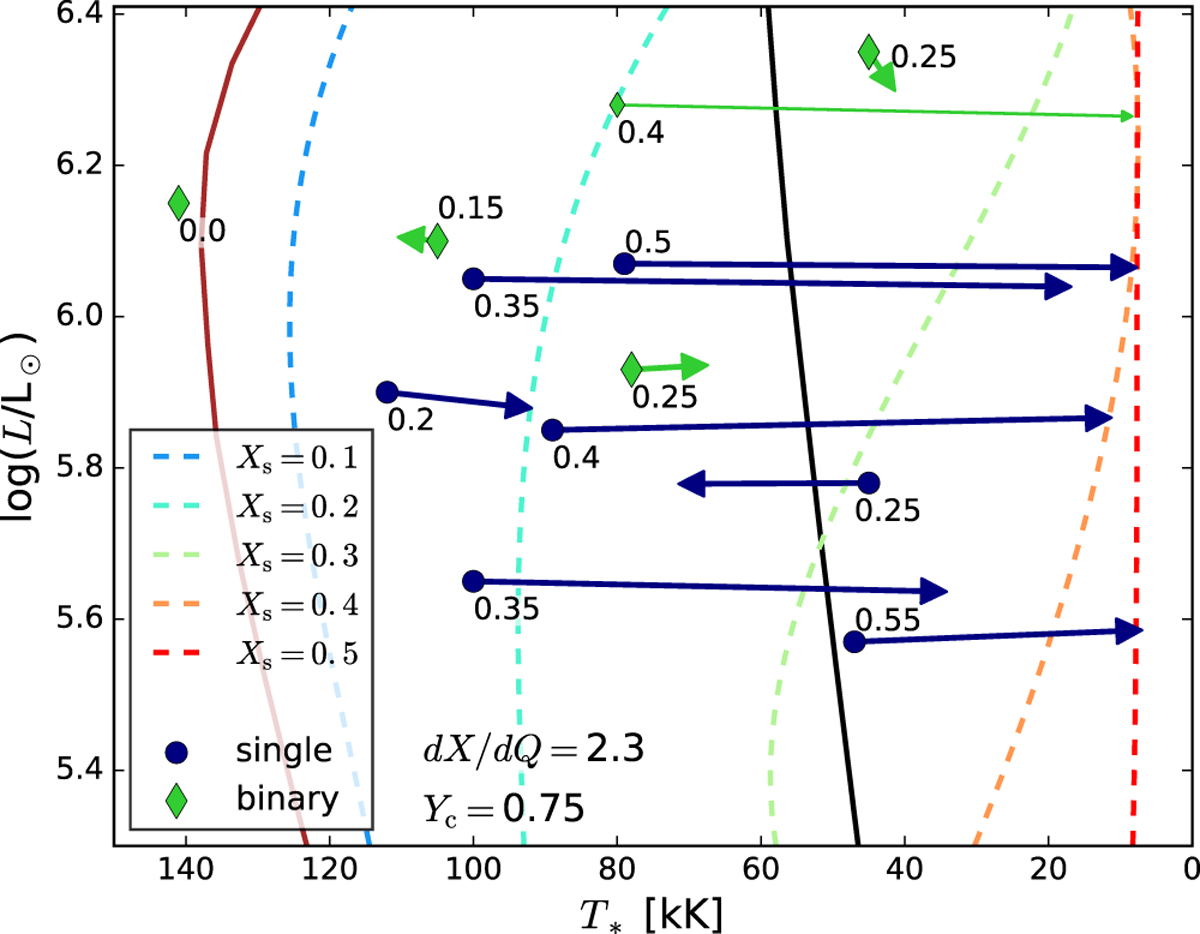
Hertzsprung–Russell diagram of models with helium cores and various hydrogen profiles displayed. The slope of the hydrogen profile has a value d X∕d Q= 2.3 (which is the typical value we infer for the SMC WR stars in binaries) for all models. The surface hydrogen mass fraction Xs is indicated by the colors of the dashed lines. Green diamonds indicate observed values for binary SMC WR stars, blue circles indicate apparently singles stars. The arrows point to models with the same log L and Xs as the observed objects. The peculiar SMC AB6 is displayed with a smaller symbol and arrow.
Current usage metrics show cumulative count of Article Views (full-text article views including HTML views, PDF and ePub downloads, according to the available data) and Abstracts Views on Vision4Press platform.
Data correspond to usage on the plateform after 2015. The current usage metrics is available 48-96 hours after online publication and is updated daily on week days.
Initial download of the metrics may take a while.