Fig. 1
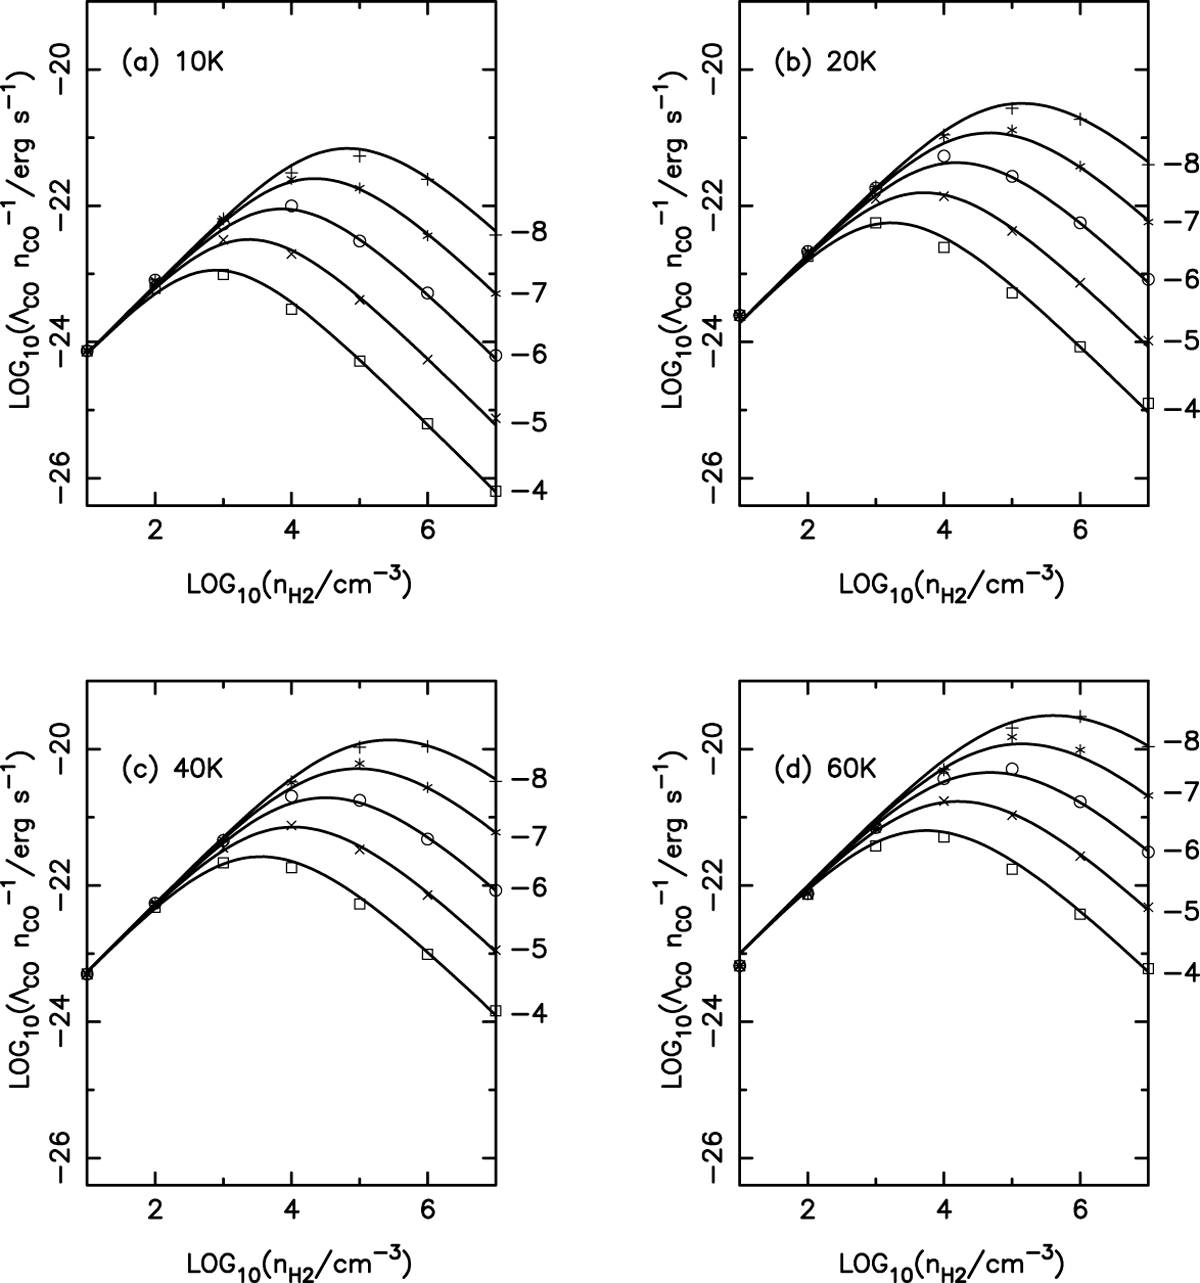
Continuous curves give the total CO cooling rate, as predicted by the approximate analytic formulation
derived here (Eqs. (15) through (18)). The different panels correspond to (a)
T = 10K ;
(b) T = 20K;
(c) T = 40K;
and (d) T = 60K
(these temperatures are given in the top lefthand corner of each panel). The different curves represent different values of
![]() (these values are given down the righthand margin of each panel). The rates obtained
by the detailed computations of GL78 are given at discrete values of the density,
(these values are given down the righthand margin of each panel). The rates obtained
by the detailed computations of GL78 are given at discrete values of the density,
![]() ;
plus signs, stars, open circles, crosses and open squares correspond respectively to
;
plus signs, stars, open circles, crosses and open squares correspond respectively to
![]() .
.
Current usage metrics show cumulative count of Article Views (full-text article views including HTML views, PDF and ePub downloads, according to the available data) and Abstracts Views on Vision4Press platform.
Data correspond to usage on the plateform after 2015. The current usage metrics is available 48-96 hours after online publication and is updated daily on week days.
Initial download of the metrics may take a while.