Fig. 7
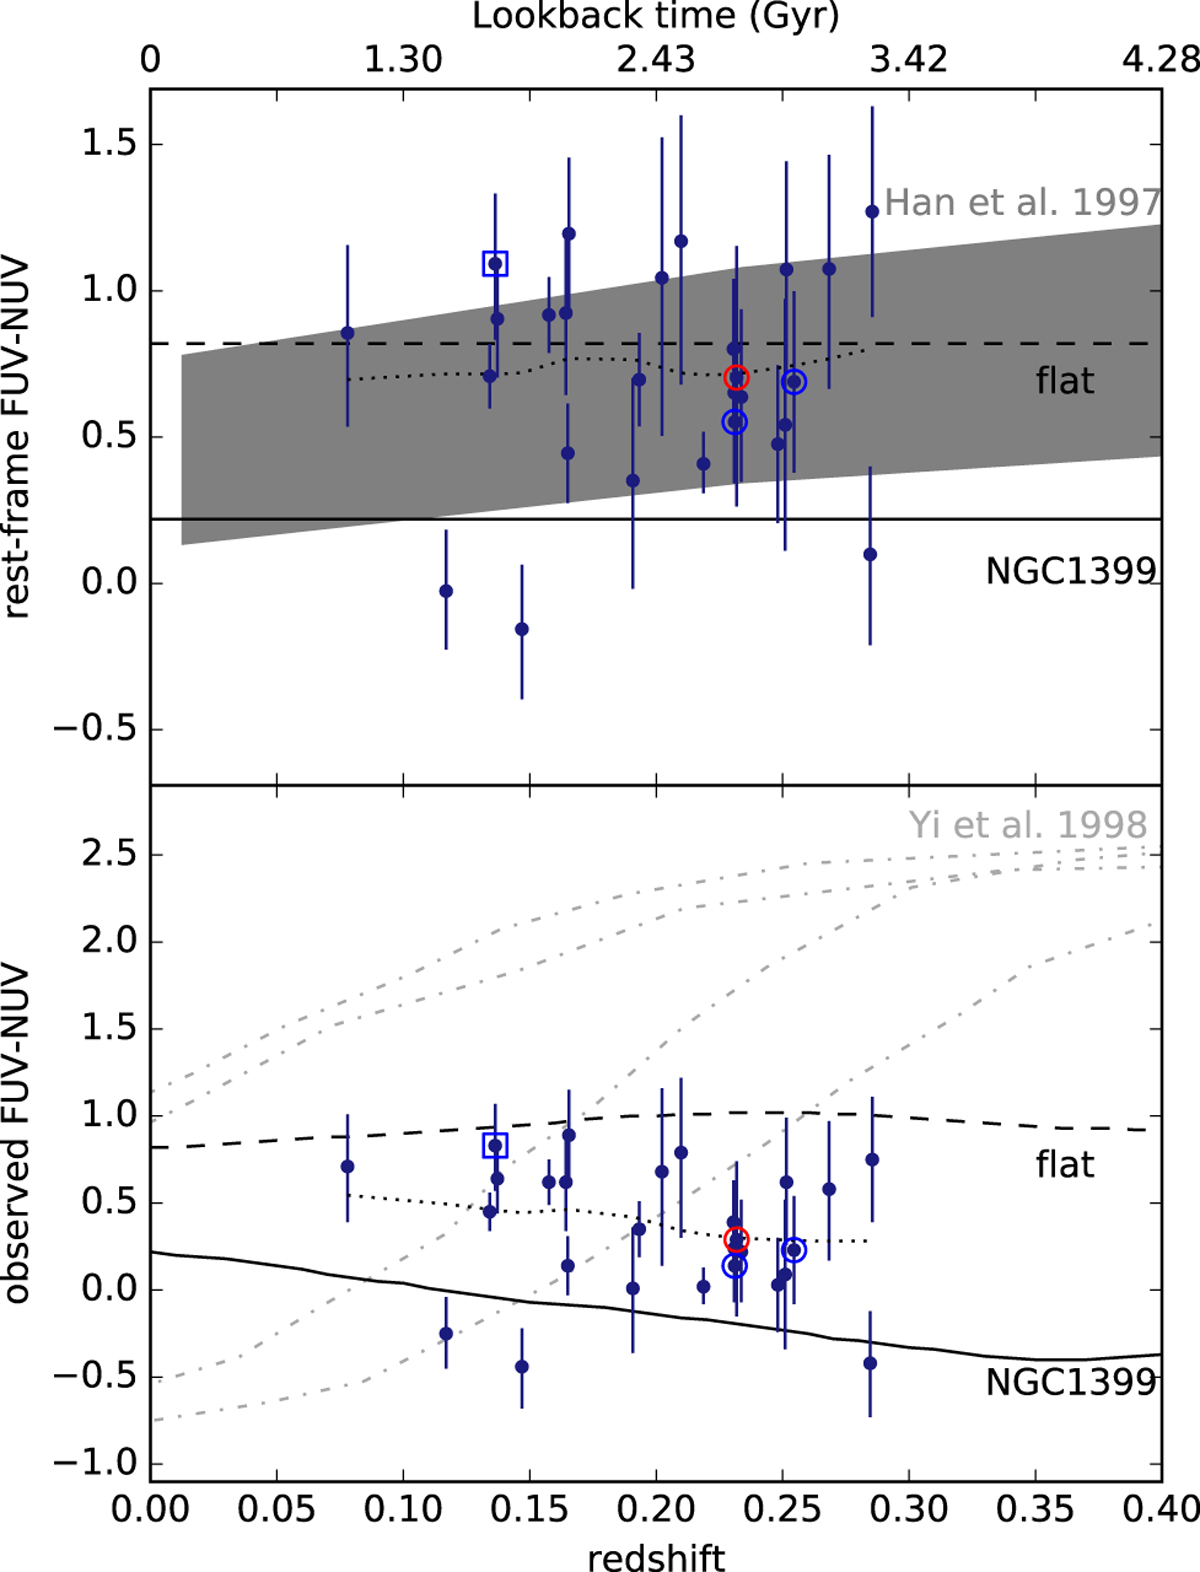
FUV-NUV color as a function of redshift as in Fig. 6, but keeping only our BCG galaxies with old populations and UV upturn, as defined by the bottom right part of Fig. 3 (confirmed upturn sample). In the top panel, we show the rest-frame color. We corrected the observed points assuming the NGC1399 spectrum since we selected upturn galaxies. In the bottom panel we show the observed color. In each panel our points are compared to model predictions. The shaded area indicates the evolution of the rest-frame color for a SSP model of Han et al. (2007) including binaries (assuming a redshift 5 formation). The dot-dashed lines indicate the observed colors in typical models of Yi et al. (1998) based on single stars, for infall histories from Tantalo et al. (1996) for two galaxy masses (1012 and 5 × 10¹¹ M⊙), and two mass-loss efficiency parameter (0.7 for the two lower and 1 for the two upper curves). The dotted curve is a LOWESS fit to our data.
Current usage metrics show cumulative count of Article Views (full-text article views including HTML views, PDF and ePub downloads, according to the available data) and Abstracts Views on Vision4Press platform.
Data correspond to usage on the plateform after 2015. The current usage metrics is available 48-96 hours after online publication and is updated daily on week days.
Initial download of the metrics may take a while.