Fig. 6
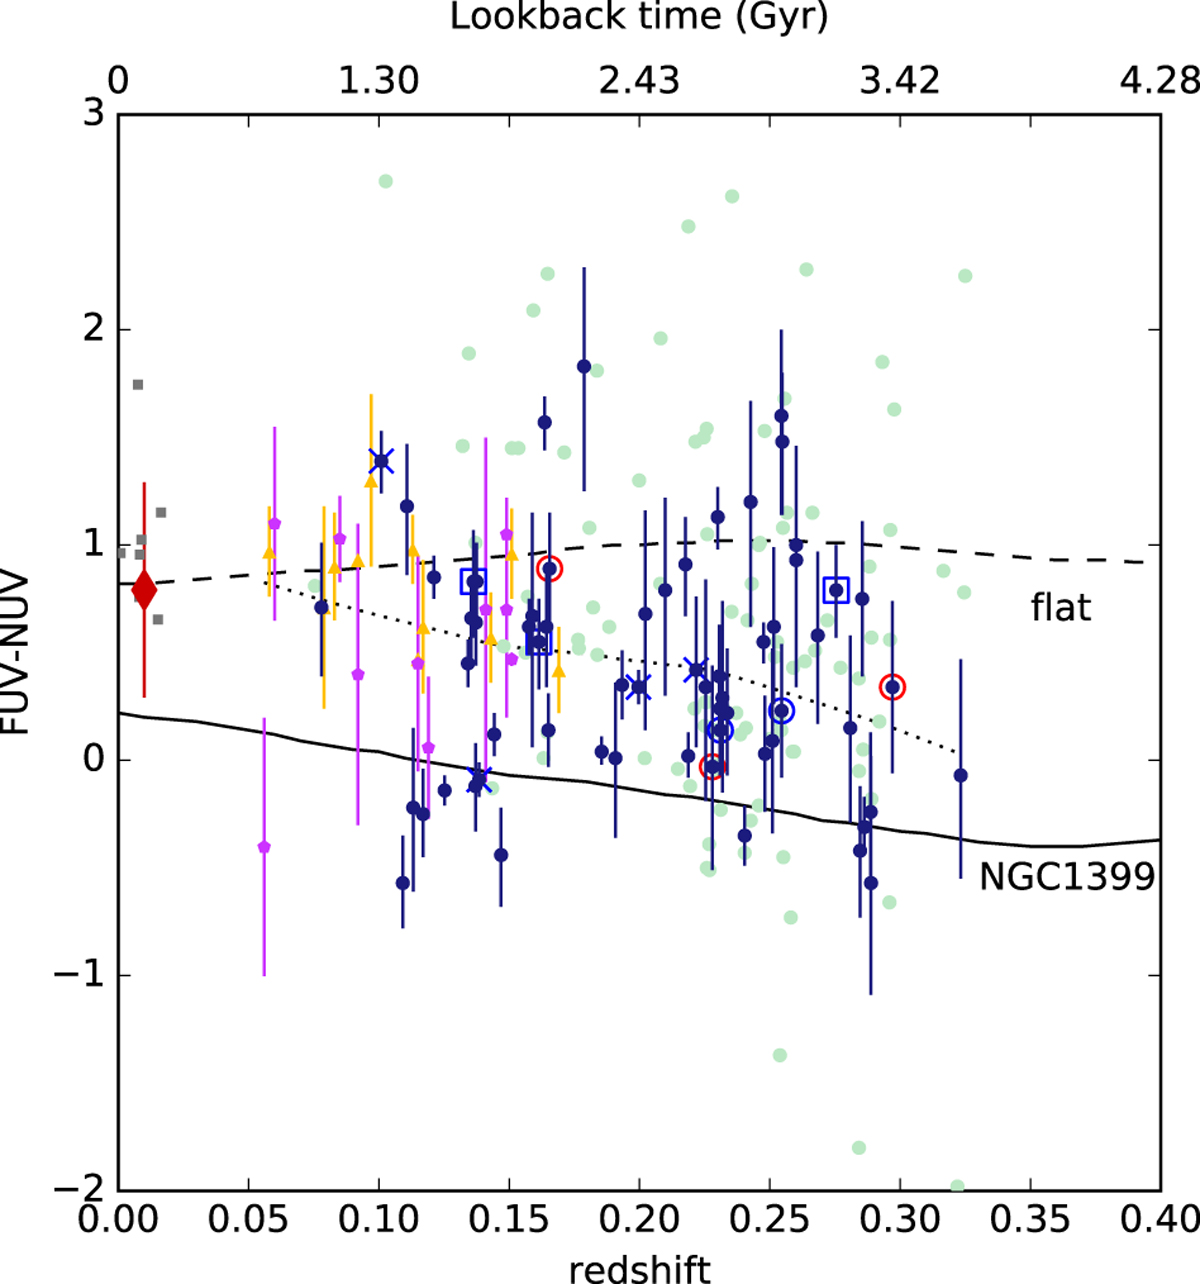
Observed FUV-NUV color as a function of redshift. The gray squares are the redshift 0 centrals of Virgo subgroups (Sect. 2.7). The diamond is the average value of Loubser & Sánchez-Blázquez (2011), the error bar corresponding to the range of values they found for local BCGs. Intermediate redshift BCGs of Ree et al. (2007) and Donahue et al. (2010) are shown as orange triangles and magenta pentagons, respectively. The circles correspond to our sample for which we use the central FUV-NUV color (smaller error bar, larger statistics). Galaxies with contamination or very large error bars (1σ interval larger than 1.2 mag) are indicated by pale green circles, others by dark blue circles with corresponding error bars. Peculiarities are marked as in Fig. 2 (noted in our visual inspection in blue; noted in the SDSS spectral subclass in red). The solid (dashed) curve shows the FUV-NUV color for the upturn spectrum of NGC1399 (for a flat spectrum) as a function of redshift. A LOWESS fit to our sample combined with the points of Donahue et al. (2010) and Ree et al. (2007) is indicated as the dotted line.
Current usage metrics show cumulative count of Article Views (full-text article views including HTML views, PDF and ePub downloads, according to the available data) and Abstracts Views on Vision4Press platform.
Data correspond to usage on the plateform after 2015. The current usage metrics is available 48-96 hours after online publication and is updated daily on week days.
Initial download of the metrics may take a while.