Fig. 5
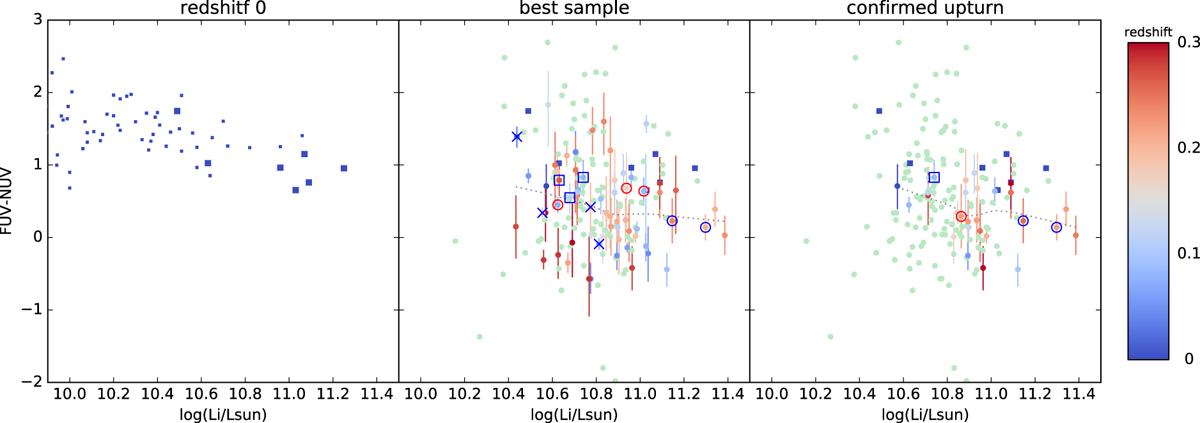
FUV-NUV color as a function of the i-band luminosity. Left panel: relation for the redshift 0 early-type galaxies (Sect. 2.7). The central galaxies of the various subgroups in Virgo are indicated by larger symbols than the rest of the sample. These centrals are repeated in the other panels (squares). Middle panel: our full and best sample (colored circles). We use the central FUV-NUV color (smaller error bar, larger statistics). Galaxies with contamination or very large error bars (1σ interval larger than 1.2 mag) are indicated by a pale green circle. For the other galaxies, the color corresponds to the redshift, as indicated in the color bar. Peculiarities found in our visual inspection (blue) or in the SDSS spectral subclass (red) are marked as in Fig. 2. The dotted line is a LOWESS fit to our sample. Right panel: colored circles are used only for the galaxies with confirmed upturn.
Current usage metrics show cumulative count of Article Views (full-text article views including HTML views, PDF and ePub downloads, according to the available data) and Abstracts Views on Vision4Press platform.
Data correspond to usage on the plateform after 2015. The current usage metrics is available 48-96 hours after online publication and is updated daily on week days.
Initial download of the metrics may take a while.