Fig. 3
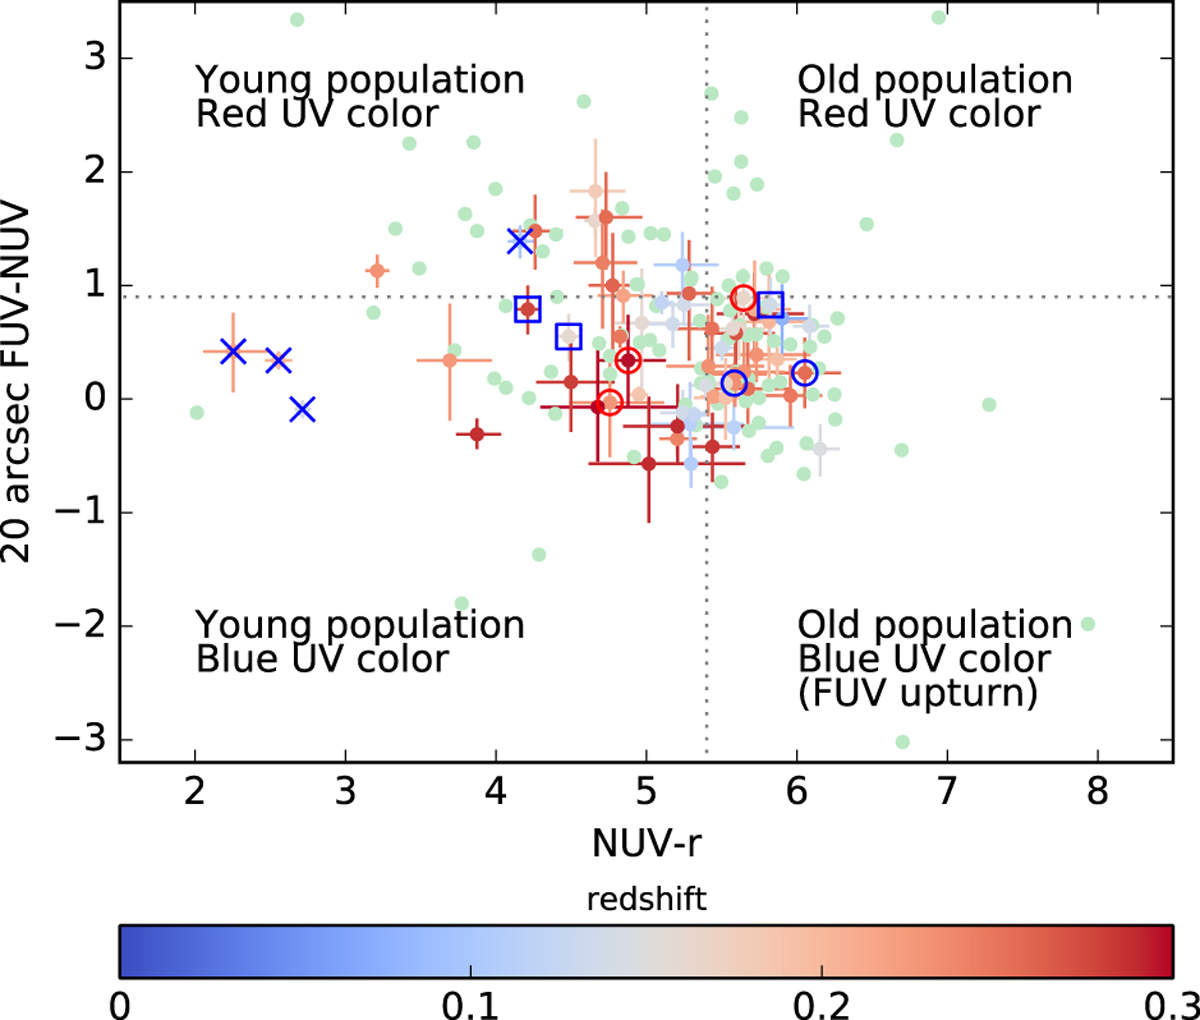
Central FUV-NUV vs. global NUV-r color-color diagram in the best sample (colored by redshift). For comparison, pale green dots show the location of the other BCGs. The vertical line indicates NUV-r = 5.4, above whichthere should be no contamination from young stars, and the horizontal line indicates FUV-NUV = 0.9, below which the UV slope is consistent with a UV upturn (Yi et al. 2011). Peculiarities found in our visual inspection (blue) or in the SDSS spectral subclass (red) are marked as in Fig. 2.
Current usage metrics show cumulative count of Article Views (full-text article views including HTML views, PDF and ePub downloads, according to the available data) and Abstracts Views on Vision4Press platform.
Data correspond to usage on the plateform after 2015. The current usage metrics is available 48-96 hours after online publication and is updated daily on week days.
Initial download of the metrics may take a while.