Fig. 1
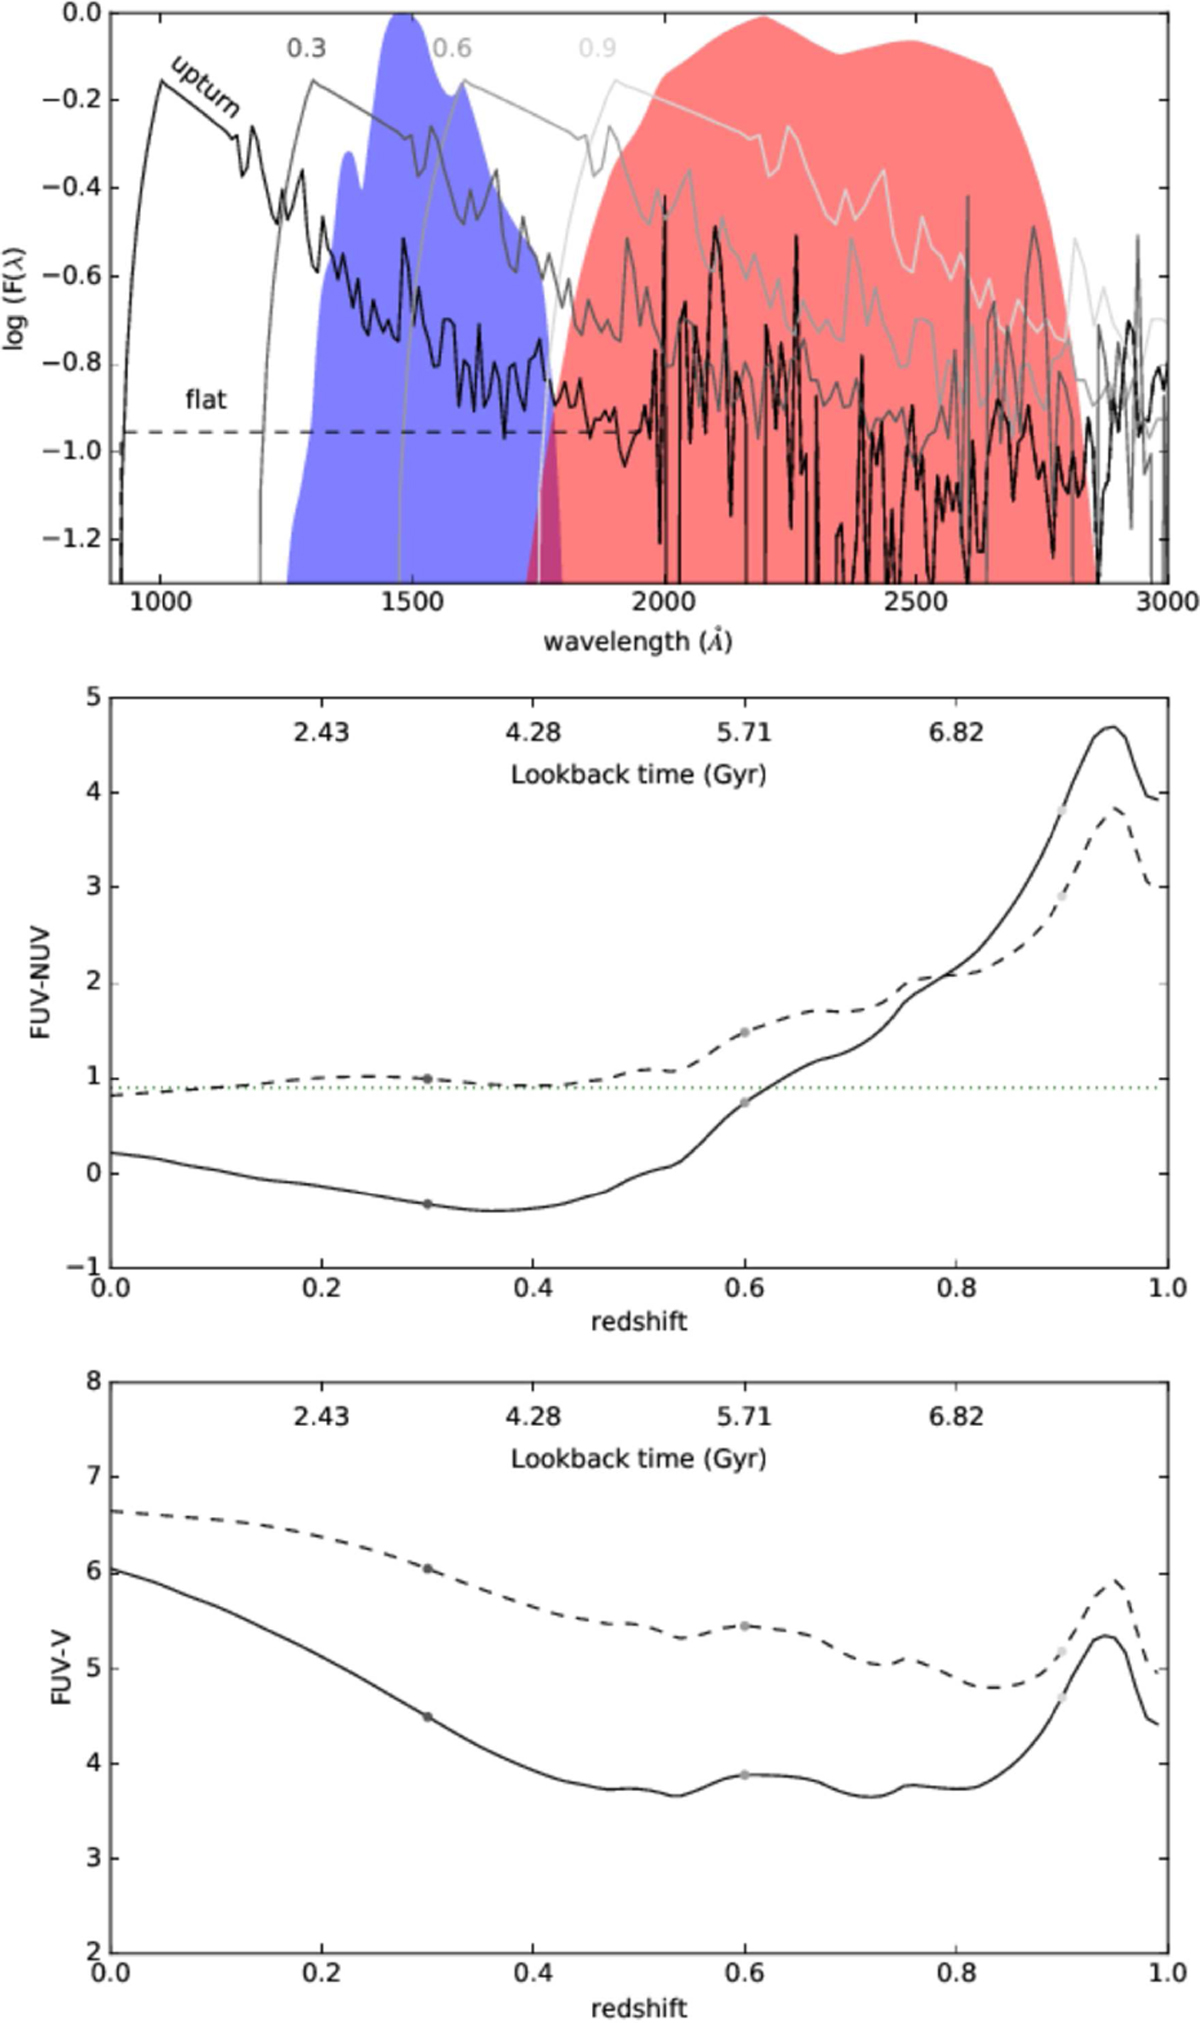
Top: Arbitrarily scaled spectrum of NGC1399 (solid line). The spectrum was taken from the database of UV-Optical Spectra of Nearby Quiescent and Active Galaxies (http://www.stsci.edu/science/sed/sed.html), the original UV data are from Burstein et al. (1988). The spectrum was smoothed for visualization, and extrapolated at low wavelength (between 912 and 1170 Å) to match a typical upturn galaxy spectra (Yi et al. 1998). This spectrum is also shown after redshifting to z = 0.3, 0.6, 0.9. A “flat” version is also shown (i.e., removing the upturn) for reference purposes (see text in the introduction). The GALEX FUV and NUV passbands are respectively indicated as a blue and red shaded area. Middle: Evolution with redshift of the FUV-NUV color for the upturn and flat spectra as the solid and dashed curve, respectively. The dotted horizontal lines corresponds to FUV-NUV = 0.9, the limiting color for an upturn as defined by Yi et al. (2011). Bottom: Evolution with redshift of the FUV-V color of the upturn and flat spectra as the solid and dashed curve, respectively.
Current usage metrics show cumulative count of Article Views (full-text article views including HTML views, PDF and ePub downloads, according to the available data) and Abstracts Views on Vision4Press platform.
Data correspond to usage on the plateform after 2015. The current usage metrics is available 48-96 hours after online publication and is updated daily on week days.
Initial download of the metrics may take a while.