Free Access
Fig. 9
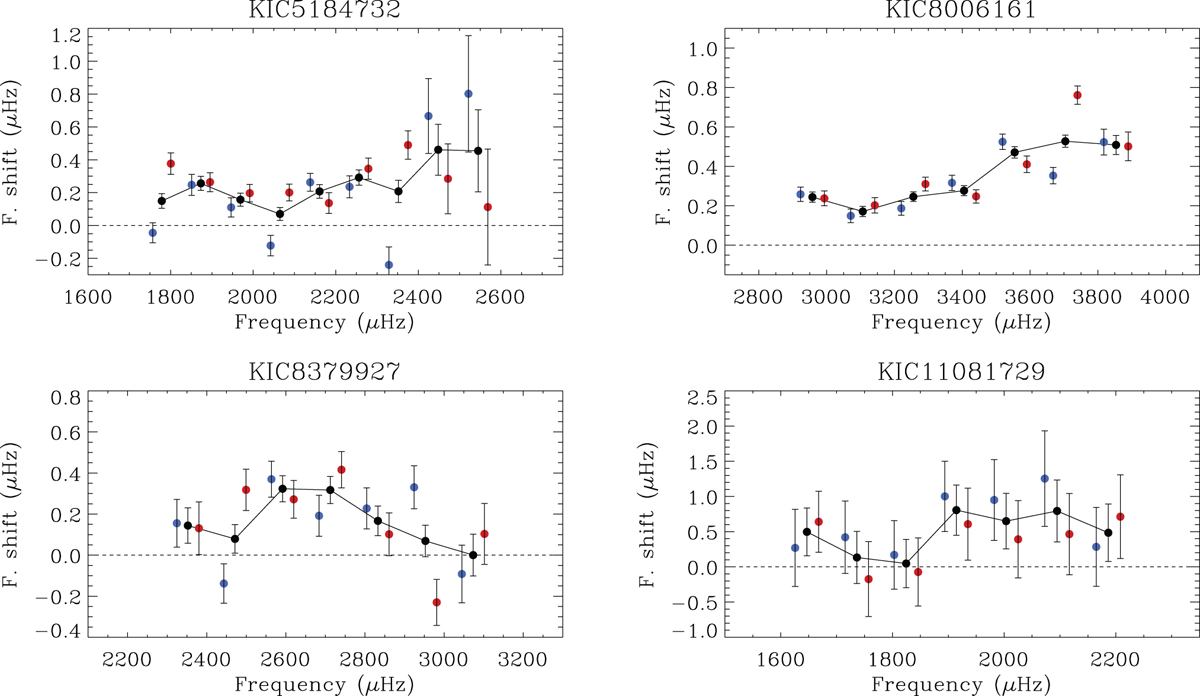
Frequency shifts of the individual l = 0 (blue) and l = 1 (red) modes as a function of frequency for KIC 5184732, KIC 8006161, KIC 8379927, and KIC 11081729 from Table 5. The black dots correspond to the averaged shifts between consecutive l = 0 and l = 1 modes. The horizontal dashed lines represent a zero shift.
Current usage metrics show cumulative count of Article Views (full-text article views including HTML views, PDF and ePub downloads, according to the available data) and Abstracts Views on Vision4Press platform.
Data correspond to usage on the plateform after 2015. The current usage metrics is available 48-96 hours after online publication and is updated daily on week days.
Initial download of the metrics may take a while.