Free Access
Fig. 7
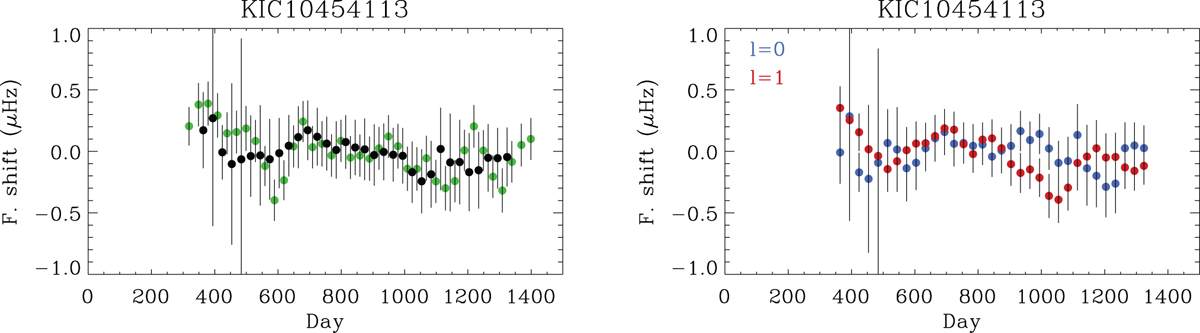
Left panel: Comparison of the temporal variability of the frequency shifts (in μHz) of KIC10454113 extracted from the cross-correlation (Method #1, in green) and peak-fitting (Method #2, in black) analyses. Right panel: Frequency shifts of the individual l = 0 (blue) and l = 1 (red) modes from Method #2.
Current usage metrics show cumulative count of Article Views (full-text article views including HTML views, PDF and ePub downloads, according to the available data) and Abstracts Views on Vision4Press platform.
Data correspond to usage on the plateform after 2015. The current usage metrics is available 48-96 hours after online publication and is updated daily on week days.
Initial download of the metrics may take a while.