Free Access
Fig. A.1
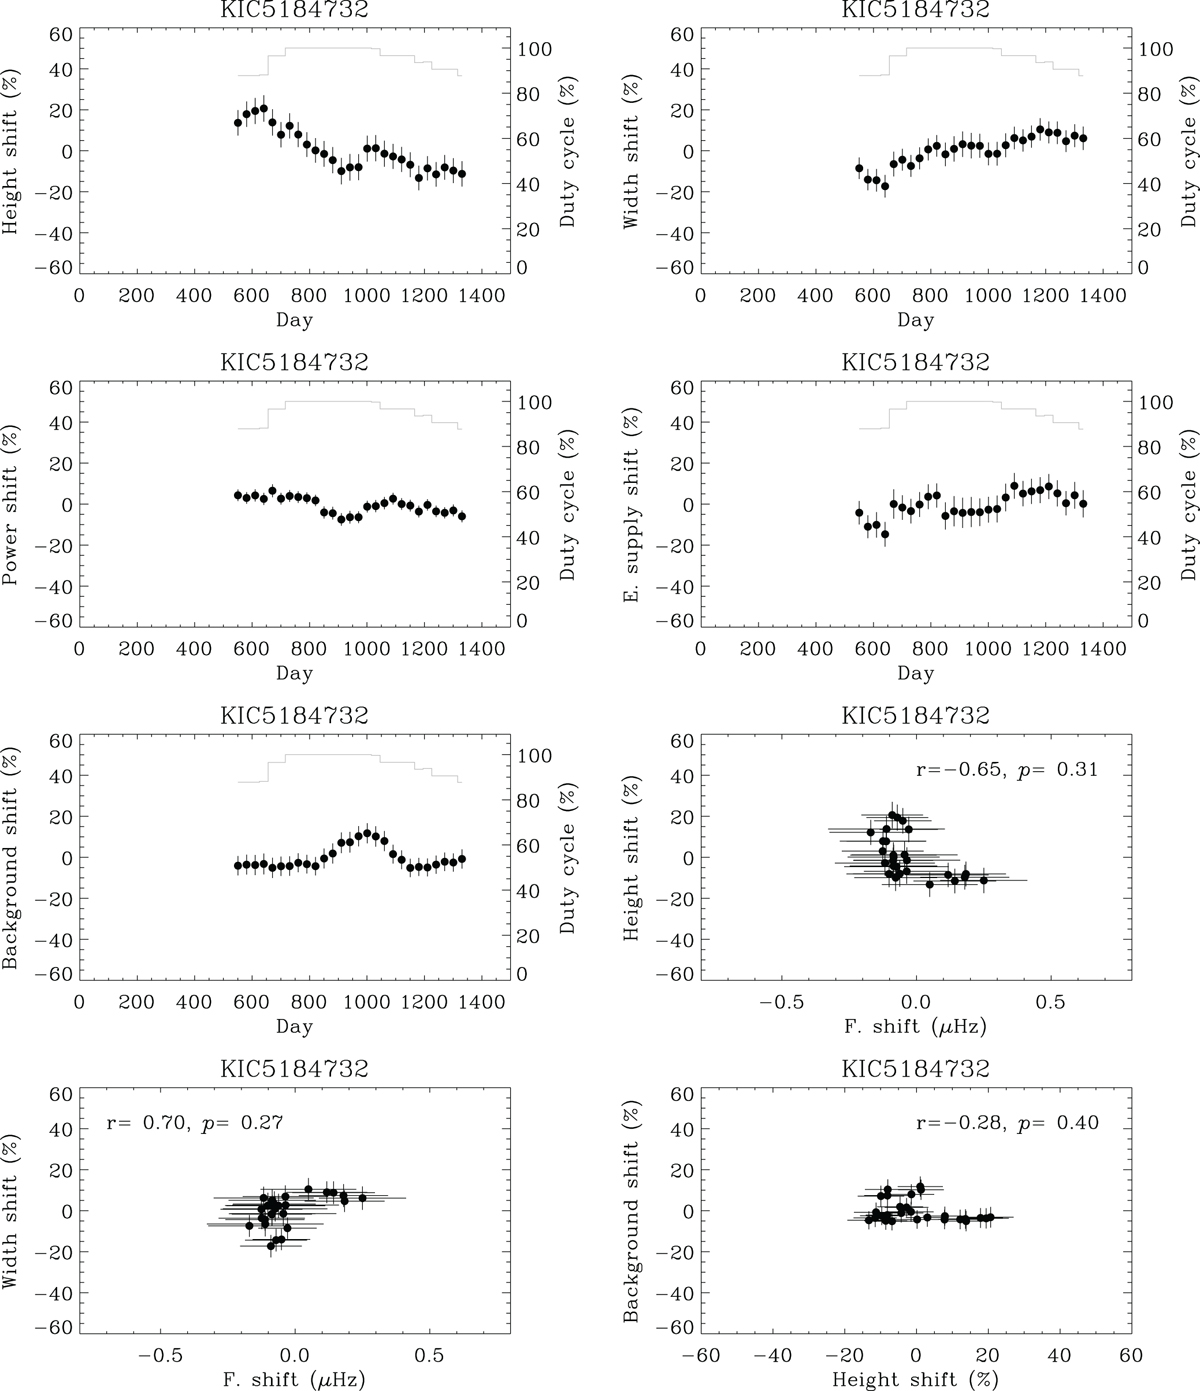
Fractional temporal variability (in %) of the p-mode power and damping parameters extracted from the peak-fitting analysis (Method #2) of KIC 5184732. The duty cycle is shown in light gray. The corresponding correlation coefficients, r , and two-sided significances of the deviation from zero, p , are also indicated.
Current usage metrics show cumulative count of Article Views (full-text article views including HTML views, PDF and ePub downloads, according to the available data) and Abstracts Views on Vision4Press platform.
Data correspond to usage on the plateform after 2015. The current usage metrics is available 48-96 hours after online publication and is updated daily on week days.
Initial download of the metrics may take a while.