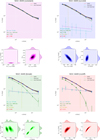
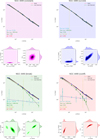
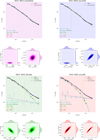
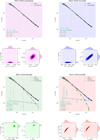
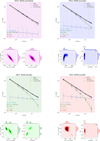
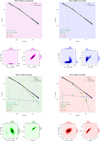
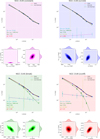
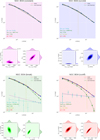
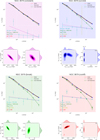
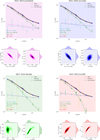
Fig. C.1
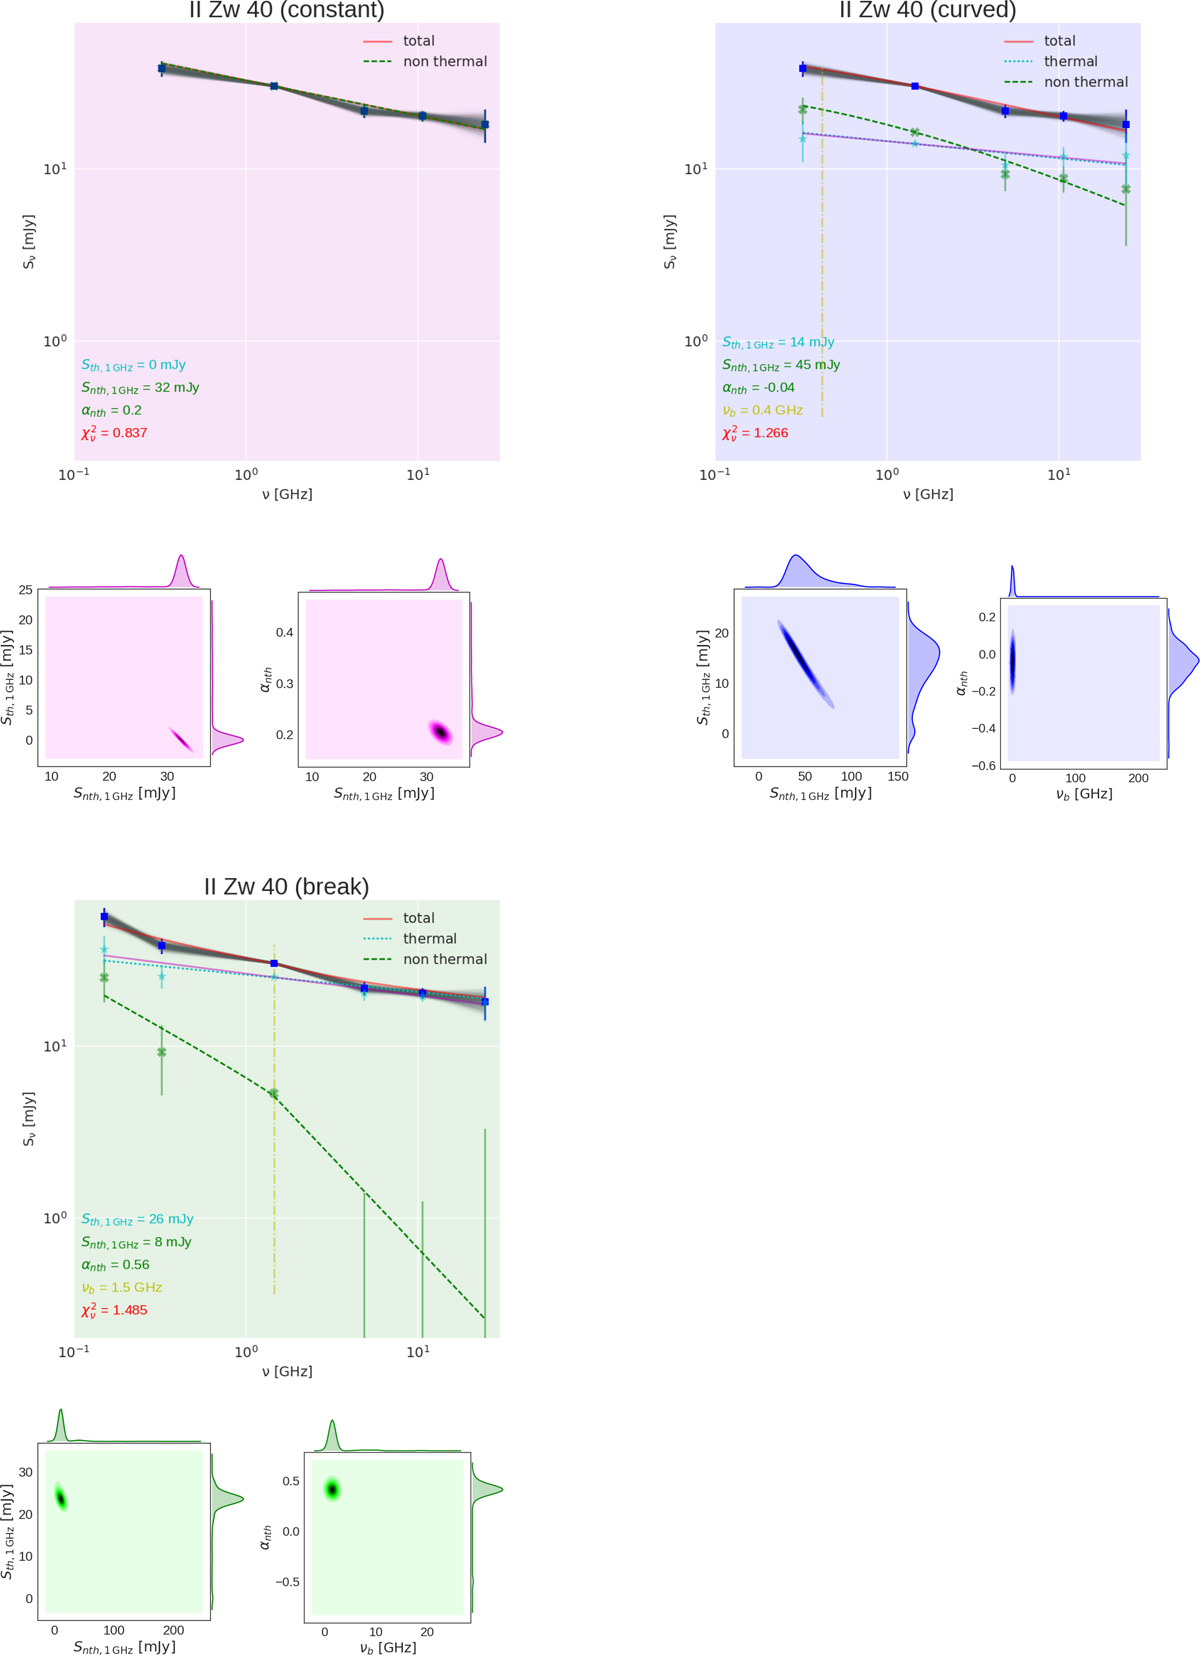
Best fit of the radio continuum spectrum is represented by a solid red line. The best
parameters are listed in the lower left part of the figure along with the reduced chi-square
(![]() ).
The faint grey lines represent the randomly 1000 spectra generated in the fitting process. The
free-free (thermal) and synchrotron (nonthermal) components of the models are depicted by the
dotted cyan line and dashed green line, respectively. The green crosses represent the observed
nonthermal component (i.e. the modeled thermal component removed from the observational data).
The cyan stars delineate the observed thermal component (i.e. the modeled nonthermal component
subtracted from the observational data). The thermal component is drawn only if the fitted coefficient,
Sth ,1 GHz,
is strictly positive. If present (curved, break, and cutoff models), the vertical dash-dotted yellow line depicts the break
frequency, νb.
The magenta line delineates a linear fit to the thermal flux densities.
).
The faint grey lines represent the randomly 1000 spectra generated in the fitting process. The
free-free (thermal) and synchrotron (nonthermal) components of the models are depicted by the
dotted cyan line and dashed green line, respectively. The green crosses represent the observed
nonthermal component (i.e. the modeled thermal component removed from the observational data).
The cyan stars delineate the observed thermal component (i.e. the modeled nonthermal component
subtracted from the observational data). The thermal component is drawn only if the fitted coefficient,
Sth ,1 GHz,
is strictly positive. If present (curved, break, and cutoff models), the vertical dash-dotted yellow line depicts the break
frequency, νb.
The magenta line delineates a linear fit to the thermal flux densities.
Current usage metrics show cumulative count of Article Views (full-text article views including HTML views, PDF and ePub downloads, according to the available data) and Abstracts Views on Vision4Press platform.
Data correspond to usage on the plateform after 2015. The current usage metrics is available 48-96 hours after online publication and is updated daily on week days.
Initial download of the metrics may take a while.