Fig. 1
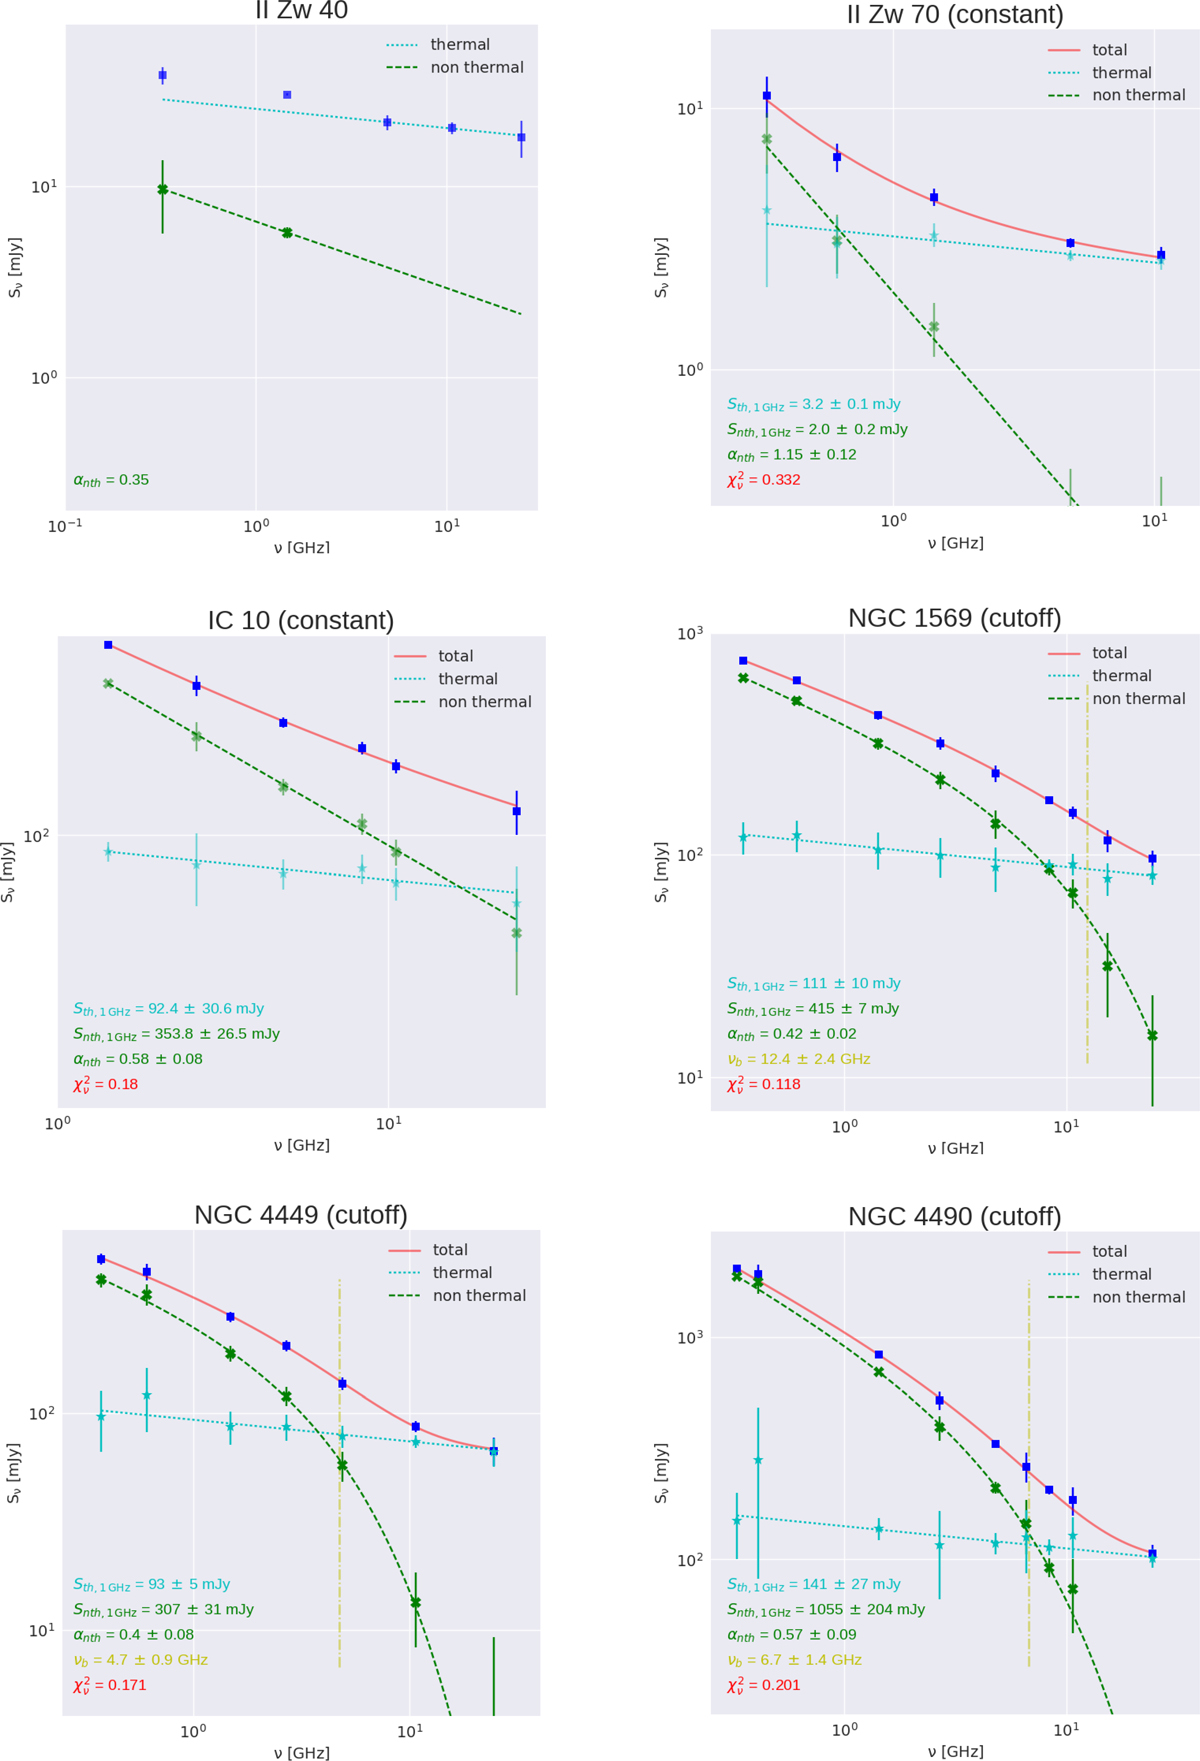
Radiocontinuum spectra of the sample galaxies. Except for II Zw 40 (see text for the procedure and plotted lines
here), the plots show the following: measured flux densities (blue squares), best fit of the radio continuum spectrum
(solid red line). The best parameters are listed in the lower left part of the figure along with the reduced chi-square
(![]() ).
The free-free (thermal) and synchrotron (nonthermal) components of the models are depicted by
the dotted cyan line and dashed green line, respectively. The green crosses represent the observed
nonthermal component (i.e. the modelled thermal component removed from the observational data).
The cyan stars delineate the observed thermal component (i.e. the modelled nonthermal component
subtracted from the observational data). The vertical yellow dash-dotted line marks the break frequency
νb .
(To be continued in Fig. A.1.)
).
The free-free (thermal) and synchrotron (nonthermal) components of the models are depicted by
the dotted cyan line and dashed green line, respectively. The green crosses represent the observed
nonthermal component (i.e. the modelled thermal component removed from the observational data).
The cyan stars delineate the observed thermal component (i.e. the modelled nonthermal component
subtracted from the observational data). The vertical yellow dash-dotted line marks the break frequency
νb .
(To be continued in Fig. A.1.)
Current usage metrics show cumulative count of Article Views (full-text article views including HTML views, PDF and ePub downloads, according to the available data) and Abstracts Views on Vision4Press platform.
Data correspond to usage on the plateform after 2015. The current usage metrics is available 48-96 hours after online publication and is updated daily on week days.
Initial download of the metrics may take a while.