Fig. A.1
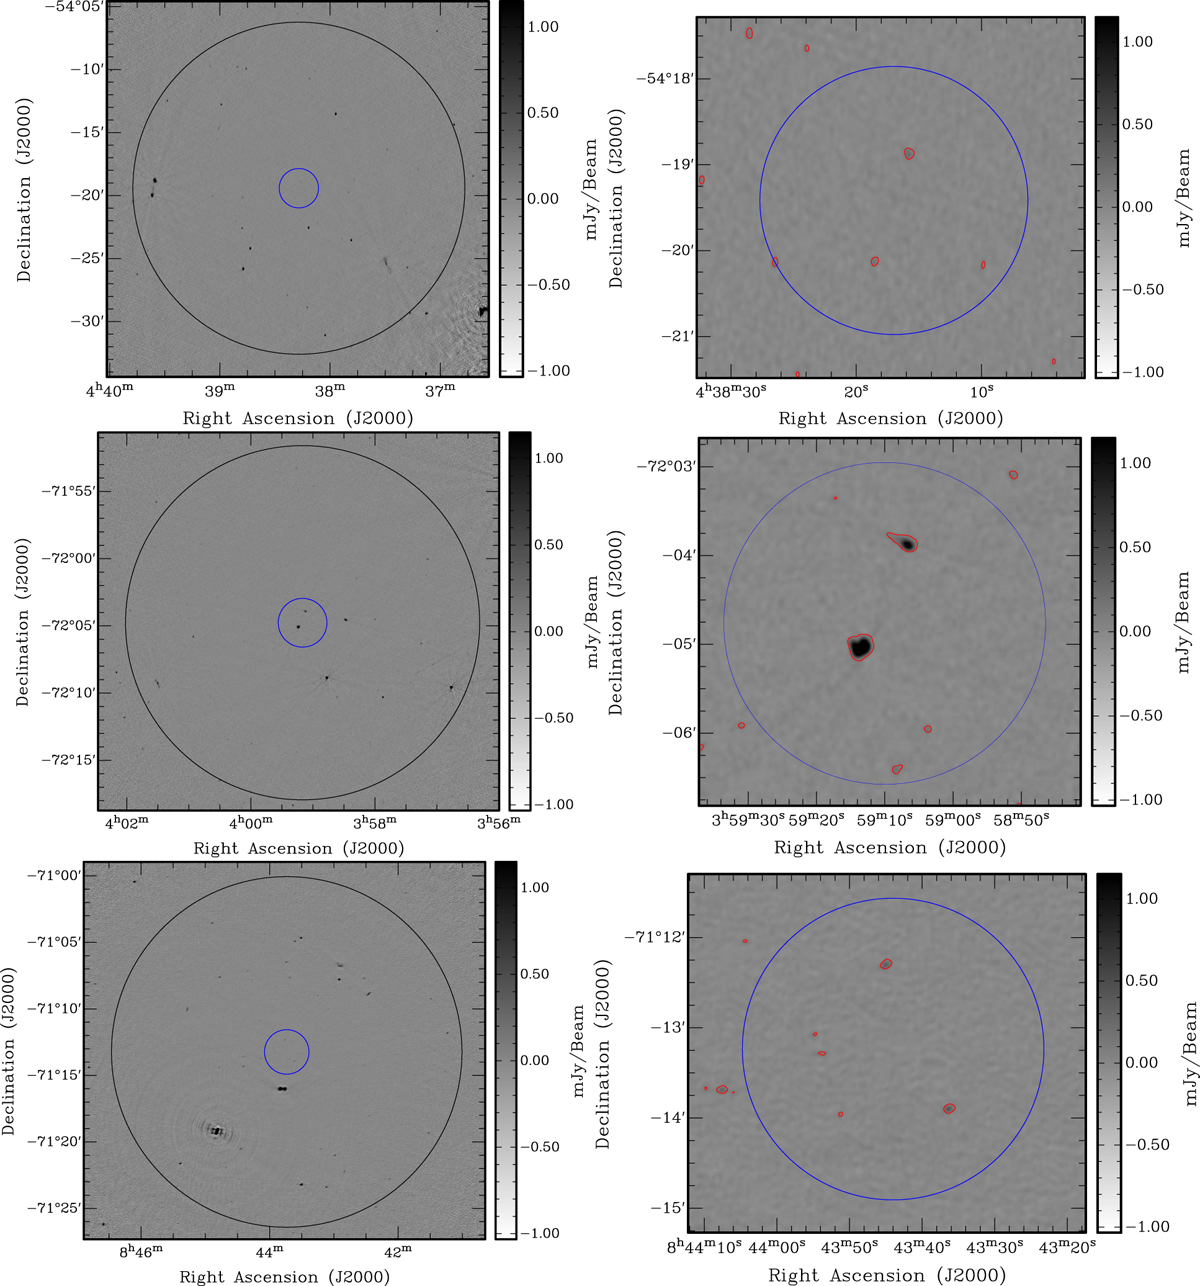
Final full-resolution, wide-band ATCA images of the cluster sample. Left panels: full field image centred on cluster coordinates. The outer circle denotes the boundary of the primary beam with a radius of ~0.22°. The central 1 Mpc-diameter region is indicated by the inner, blue smaller circle. Right panels: zoom into the central area with 3σ contours of the corresponding map overlaid in red. Top: PSZ2 G262.73-40.92; middle: PSZ2 G286.28-38.36; bottom: PSZ2 G285.63-17.23.
Current usage metrics show cumulative count of Article Views (full-text article views including HTML views, PDF and ePub downloads, according to the available data) and Abstracts Views on Vision4Press platform.
Data correspond to usage on the plateform after 2015. The current usage metrics is available 48-96 hours after online publication and is updated daily on week days.
Initial download of the metrics may take a while.