Fig. 5
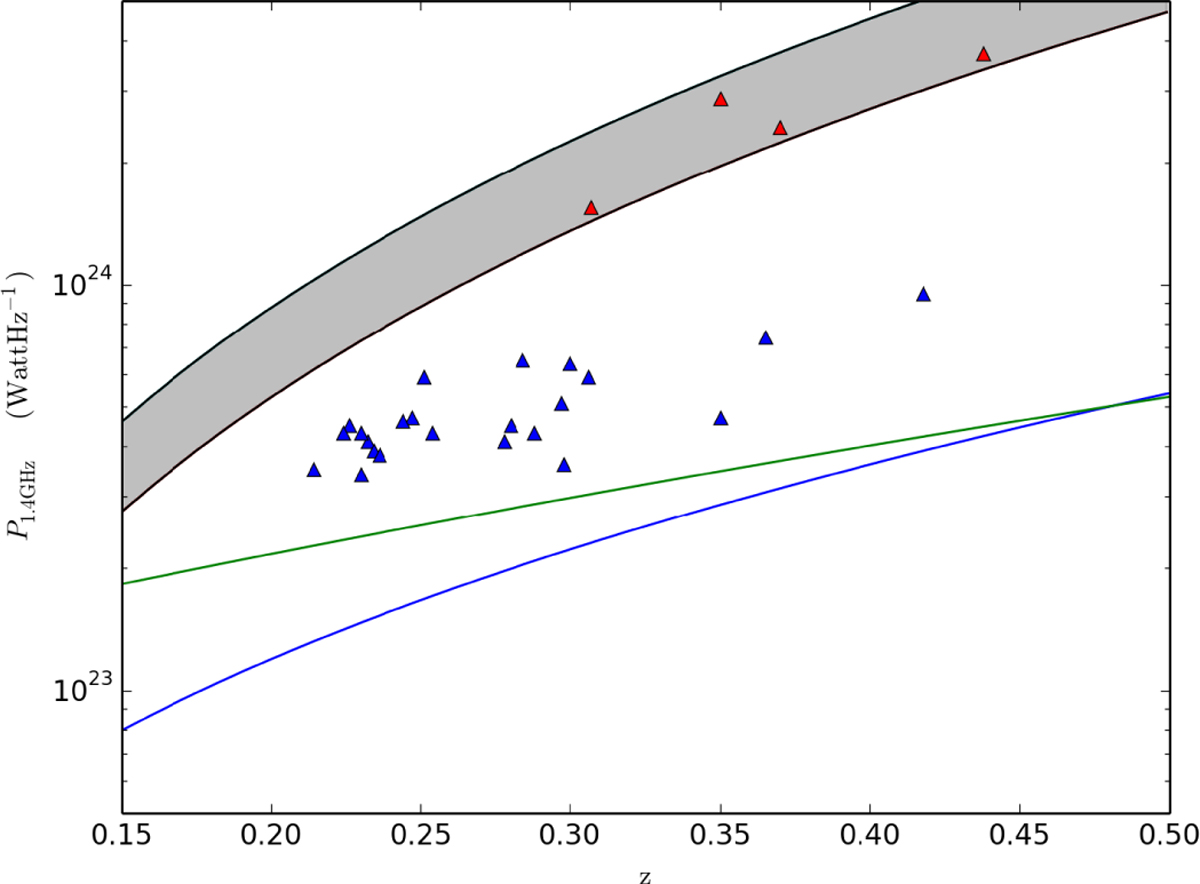
Upper limit radio powers rescaled at 1.4 GHz vs. redshiftfor our ATCA observations (red triangles) and GMRTobservations Venturi et al. (2008) and Kale et al. (2013) (blue triangles). The lower (upper) border of the grey band corresponds to the lowest (highest) detection limit of injected fluxes, i.e. 3 mJy (5 mJy) for our ATCA images. The green and blue lines show the minimum power at 1.4 GHz of detectable radio haloes in the EMU survey as derived in Cassano et al. (2012).
Current usage metrics show cumulative count of Article Views (full-text article views including HTML views, PDF and ePub downloads, according to the available data) and Abstracts Views on Vision4Press platform.
Data correspond to usage on the plateform after 2015. The current usage metrics is available 48-96 hours after online publication and is updated daily on week days.
Initial download of the metrics may take a while.