Fig. 4
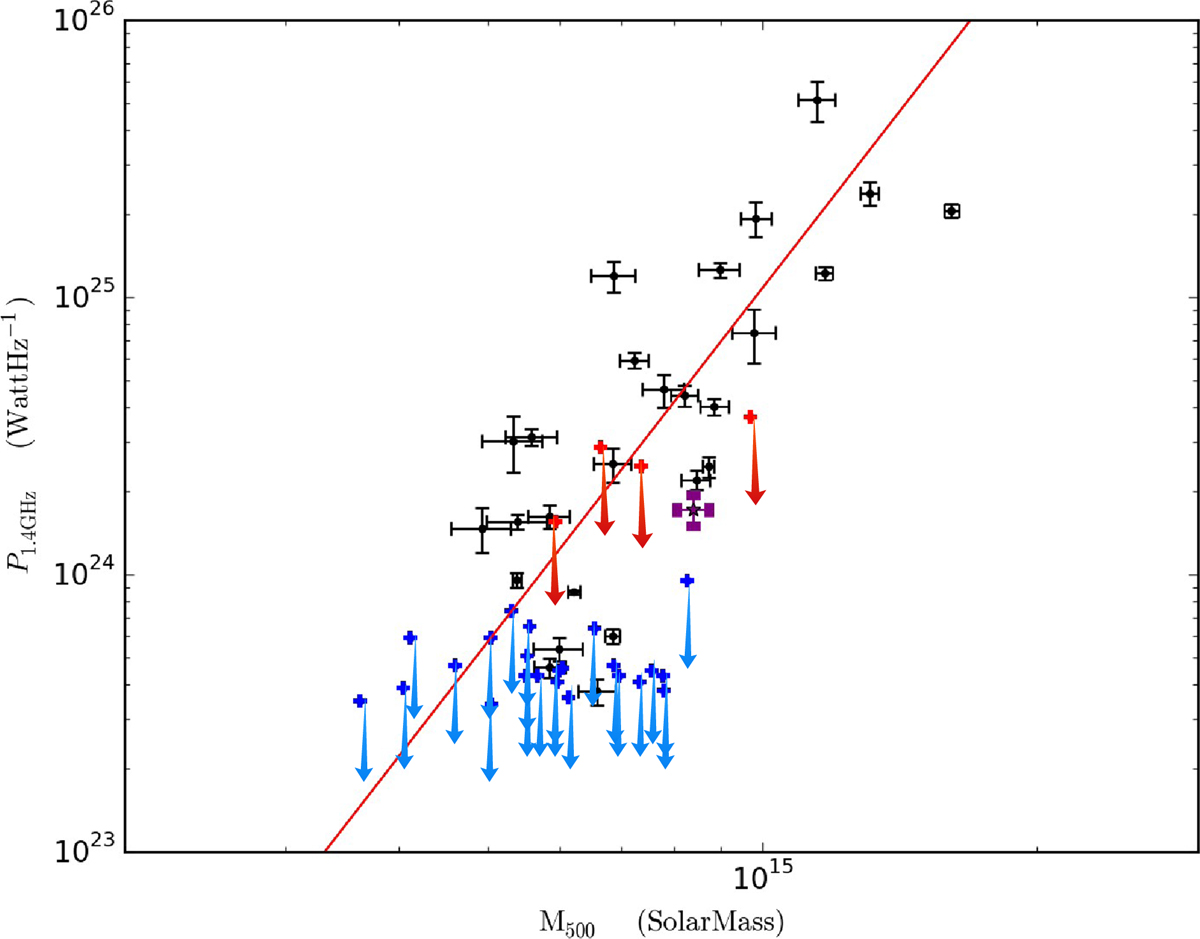
Synchrotron power of RHs at 1.4 GHz (P1.4 GHz) vs. cluster mass M500 (from Planck Collaboration 2016). Detected radio haloes reported in the literature measured at 1.4 GHz (see Martinez Aviles et al. 2016) are shown in black dots. The red line is the best fit for the black dots. The purple star corresponds to the radio halo on PSZ2 G284.97-23.69. The blue arrows correspond to detection limits appearing in Cassano et al. (2013) and references therein. The red arrows are the upper limits for the non-detections presented in this paper (see Table 4).
Current usage metrics show cumulative count of Article Views (full-text article views including HTML views, PDF and ePub downloads, according to the available data) and Abstracts Views on Vision4Press platform.
Data correspond to usage on the plateform after 2015. The current usage metrics is available 48-96 hours after online publication and is updated daily on week days.
Initial download of the metrics may take a while.