Fig. 2
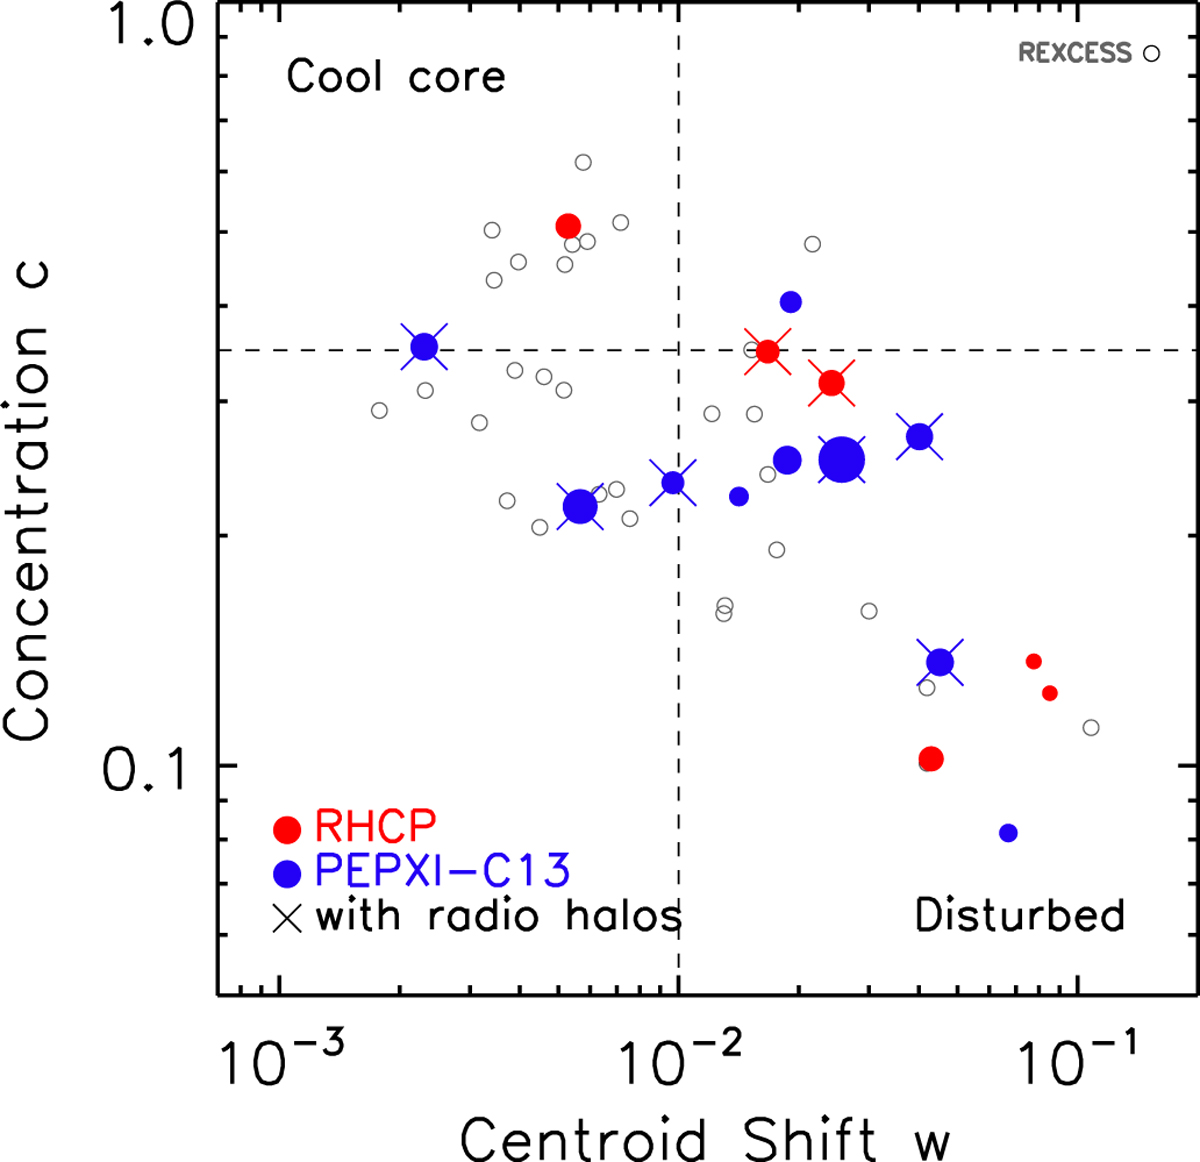
Concentration parameter C vs. centroid shift w for the galaxy clusters of the RHCP sample analysed in this paper (red filled circles). For comparison, we also show the clusters in the sample of Cassano et al. (2013) that appearin the sub-sample of Planck clusters studied by Planck Collaboration (2011a) (PEPXI-C13, blue filled circles) for which we applied our algorithm to compute the w values within R500. The size of the circles is proportional to the log (M500), in the range [14.67–15.3], and clusters with detected radio haloes are indicated with a cross. The characteristic thresholds indicating cool cores and morphologically disturbed systems (dashed lines) are from the rexcess study (Böhringer et al. 2007). The rexcess clusters are shown as open circles.
Current usage metrics show cumulative count of Article Views (full-text article views including HTML views, PDF and ePub downloads, according to the available data) and Abstracts Views on Vision4Press platform.
Data correspond to usage on the plateform after 2015. The current usage metrics is available 48-96 hours after online publication and is updated daily on week days.
Initial download of the metrics may take a while.