Fig. 1
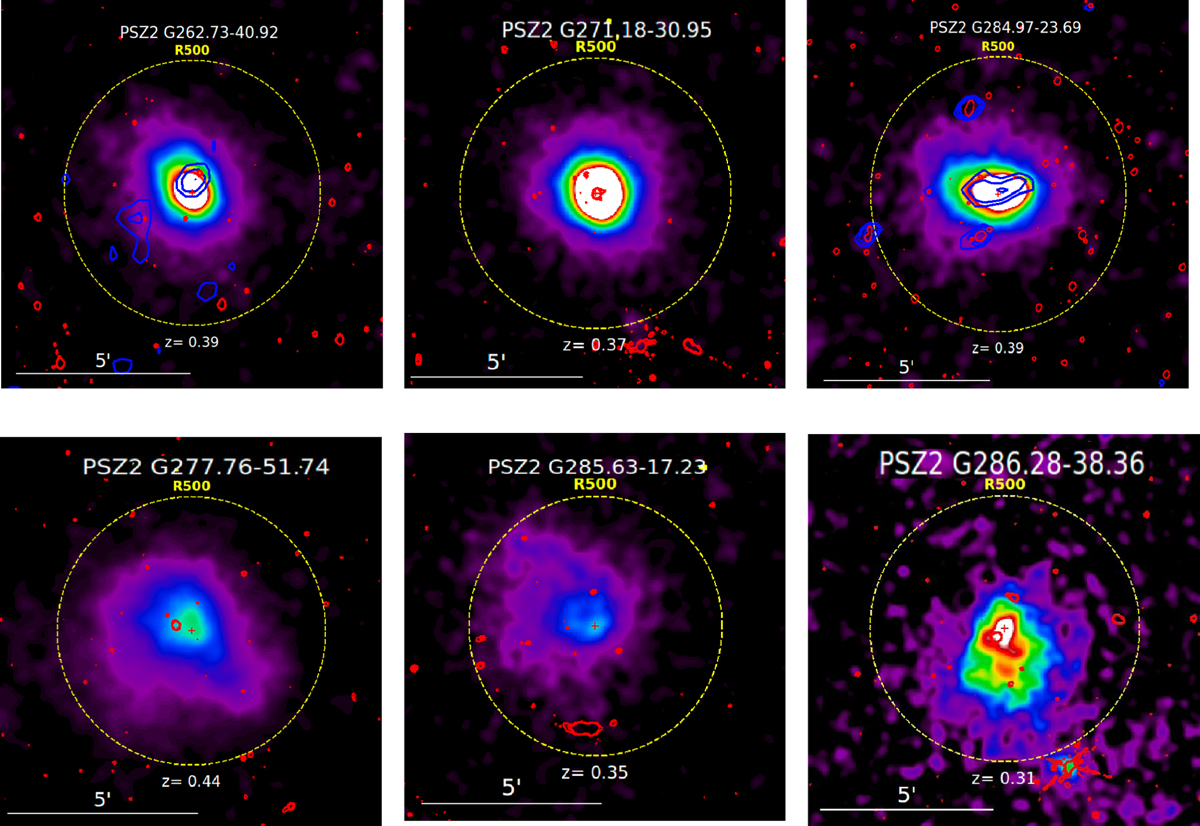
XMM-Newton smoothed images in the [0.3–2]
keV band of the ATCA cluster sample overlaid with the
![]() contours of the high resolution wide band radio maps (see
Table 3 and Figs. A.1 and
A.2) in red and the same contour levels
for the Block 3 low resolution compact source subtracted
maps for the two clusters with diffuse radio emission (see
Sect. 6) in blue. The background of the
X-ray images has been subtracted. The X-ray images are
corrected from surface brightness dimming with redshift,
divided by emissivity in the energy band, taking in account
absorption from the Galaxy and the response of the
instrument. Finally the images are scaled to a self-similar
model. The colours are selected so that the images would
look identical when scaled by their mass if they were at the
same distance; this gives us a visual hint of the dynamical
state of the clusters.
contours of the high resolution wide band radio maps (see
Table 3 and Figs. A.1 and
A.2) in red and the same contour levels
for the Block 3 low resolution compact source subtracted
maps for the two clusters with diffuse radio emission (see
Sect. 6) in blue. The background of the
X-ray images has been subtracted. The X-ray images are
corrected from surface brightness dimming with redshift,
divided by emissivity in the energy band, taking in account
absorption from the Galaxy and the response of the
instrument. Finally the images are scaled to a self-similar
model. The colours are selected so that the images would
look identical when scaled by their mass if they were at the
same distance; this gives us a visual hint of the dynamical
state of the clusters.
Current usage metrics show cumulative count of Article Views (full-text article views including HTML views, PDF and ePub downloads, according to the available data) and Abstracts Views on Vision4Press platform.
Data correspond to usage on the plateform after 2015. The current usage metrics is available 48-96 hours after online publication and is updated daily on week days.
Initial download of the metrics may take a while.