Fig. 20
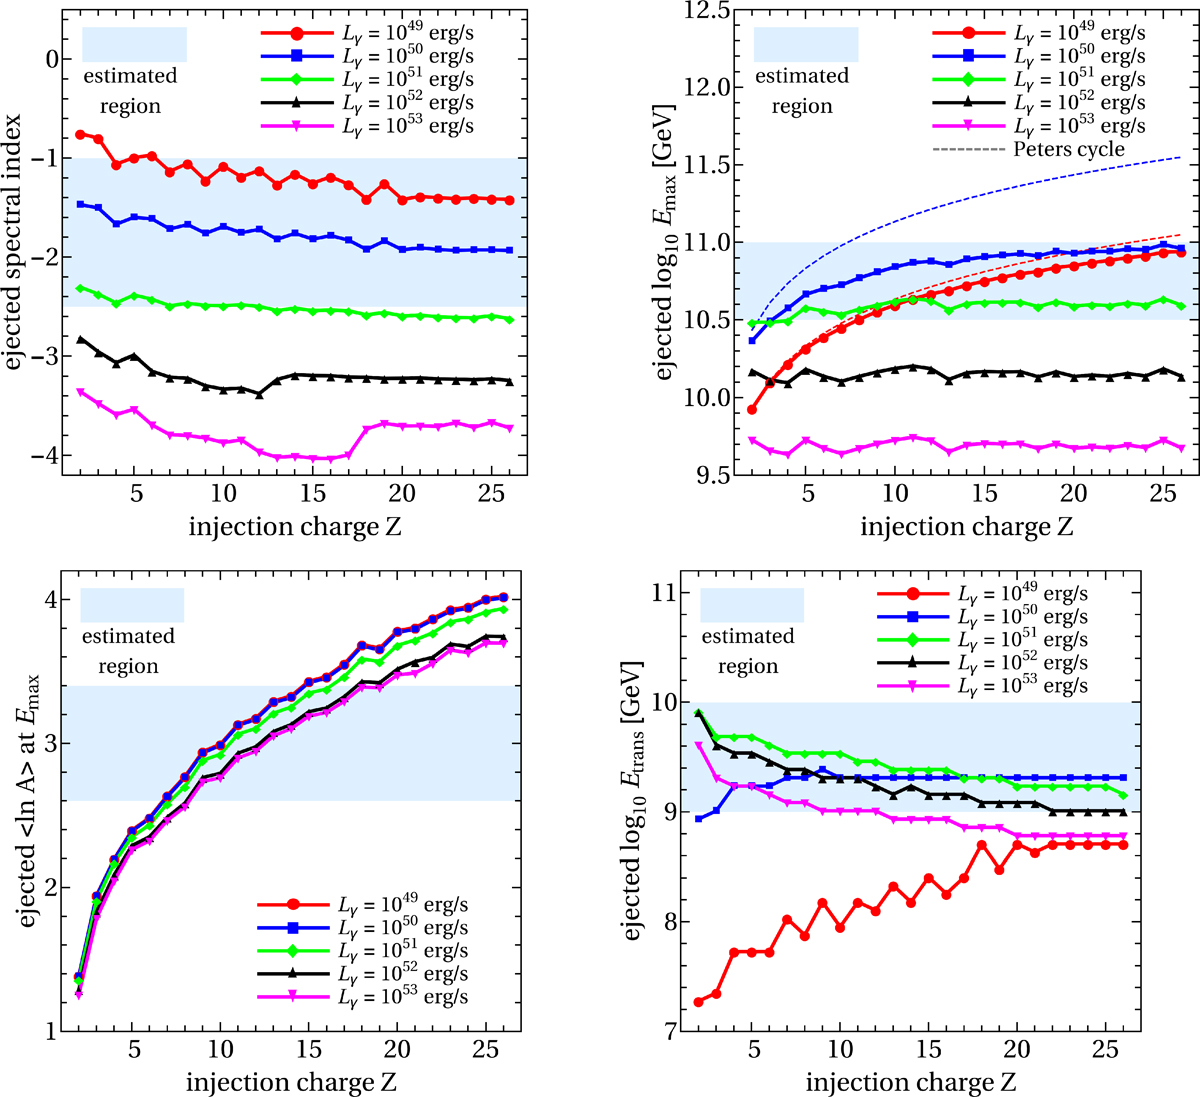
Qualitative estimators, as defined in the main text, for the UHECR fit as a function of injection Z. The shaded regions illustrate our expectations from cosmic ray data (top left from Heinze et al. 2016; top right and bottom left from Aab et al. 2017; and bottom right from Kampert & Unger 2012). The different curves correspond to different values of Lγ , as illustrated in the legend. In the upper right panel, the maximal energy following the Peters cycle (rigidity dependent maximal energy) is illustrated for two examples. The production radius is fixed to R ≃ 108.3 km in this figure.
Current usage metrics show cumulative count of Article Views (full-text article views including HTML views, PDF and ePub downloads, according to the available data) and Abstracts Views on Vision4Press platform.
Data correspond to usage on the plateform after 2015. The current usage metrics is available 48-96 hours after online publication and is updated daily on week days.
Initial download of the metrics may take a while.