Fig. 12
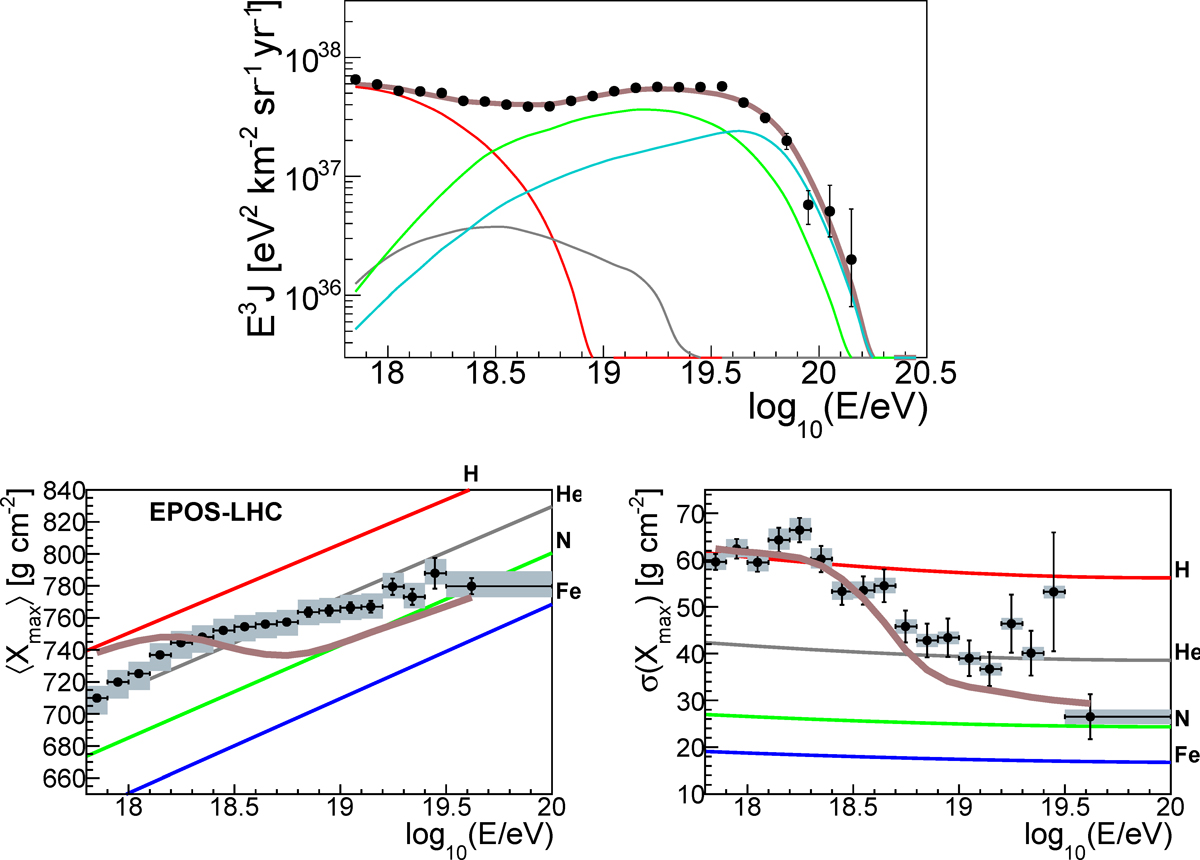
Cosmic ray observables obtained with the best-fit parameters in the Mixed Composition Dip Model, corresponding to point A for (log10(R∕km), log10(Lγ∕(erg s−1))) = (8.1,50.5) in Fig. 11. Top: simulated energy spectrum of UHECR (multiplied by E3 ) compared to data from Valiño et al. (2015). Spectra at Earth are grouped according to the mass number as follows: A = 1 (red), 2≤ A ≤ 4 (gray), 5 ≤ A ≤ 22 (green), 23 ≤ A ≤ 28 (cyan), total (brown). Bottom: average and standard deviation of the Xmax distribution as predicted (assuming EPOS-LHC, Pierog et al. 2015, for UHECR-air interactions) for the model versus pure (1 H (red), 4 He (grey), 14N (green), and 56Fe (blue)) compositions, compared to data from Porcelli et al. (2015).
Current usage metrics show cumulative count of Article Views (full-text article views including HTML views, PDF and ePub downloads, according to the available data) and Abstracts Views on Vision4Press platform.
Data correspond to usage on the plateform after 2015. The current usage metrics is available 48-96 hours after online publication and is updated daily on week days.
Initial download of the metrics may take a while.