Fig. 7
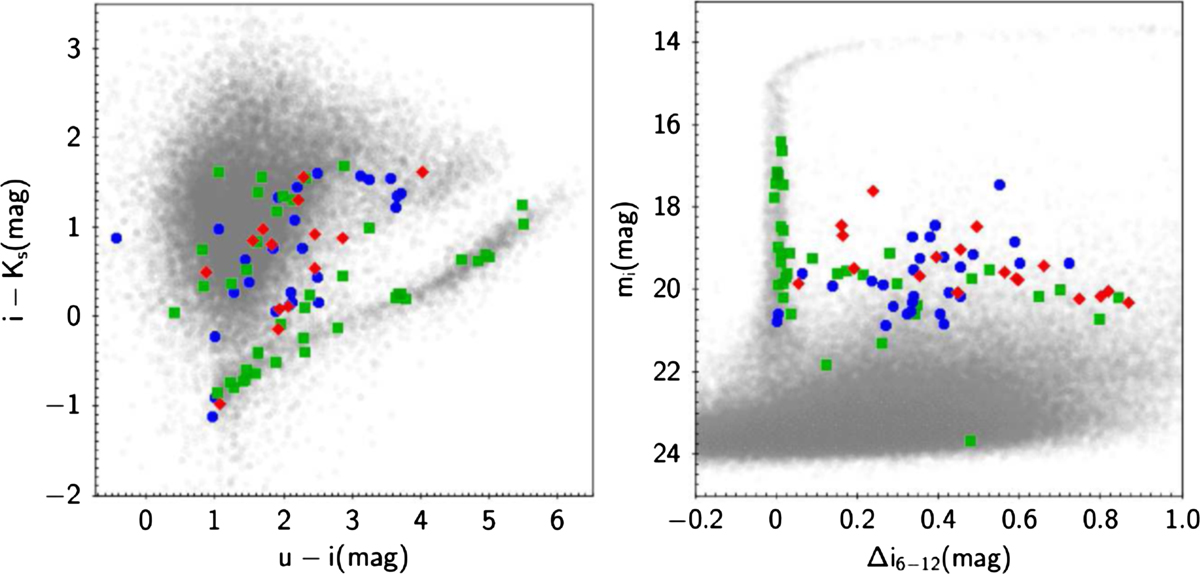
Color–color (uiKs, left) and i-band concentration index (Δi6−12, right) diagrams for the full matched catalog (gray symbols) and the photometric GC candidates from the literature. Red diamonds, blue circles, and green squares indicate Liller & Alcaino (1983), Blecha (1986), and Beasley & Sharples (2000, Table 6) GC candidates, respectively.
Current usage metrics show cumulative count of Article Views (full-text article views including HTML views, PDF and ePub downloads, according to the available data) and Abstracts Views on Vision4Press platform.
Data correspond to usage on the plateform after 2015. The current usage metrics is available 48-96 hours after online publication and is updated daily on week days.
Initial download of the metrics may take a while.