Fig. 6
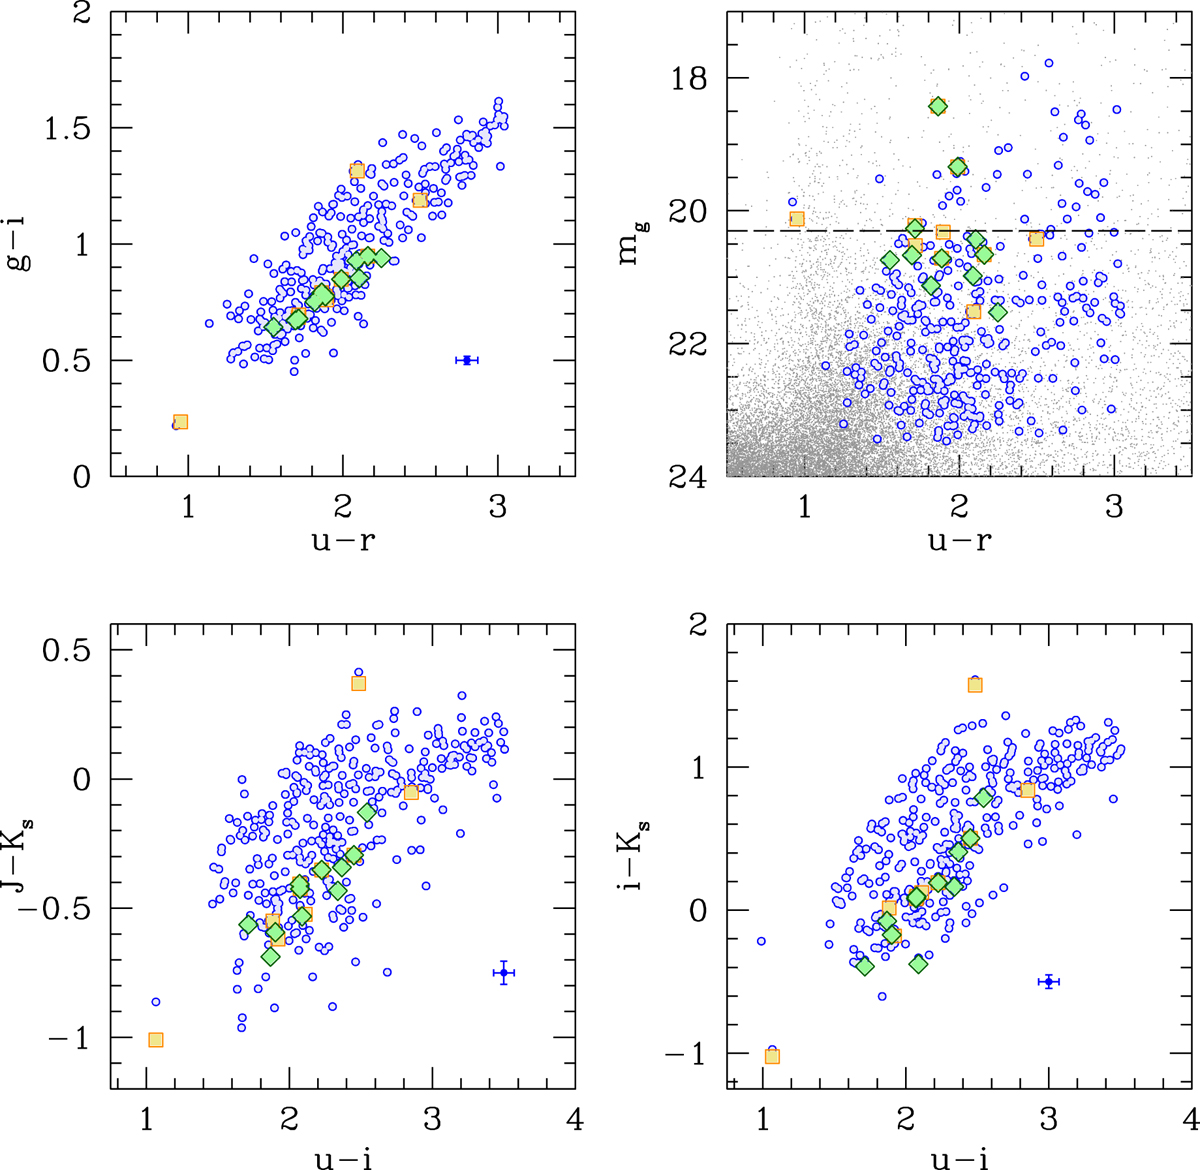
Color–color (upper left and lower panels) and color–magnitude (upper right) diagrams of the ∼ 350 selected GC candidates (blue circles) and the spectroscopically confirmed GCs. Yellow squares and green diamonds indicate the Beasley & Sharples (2000) and Olsen et al. (2004) samples, respectively. For the color–magnitude diagram, the full sample of matched sources (gray dots) and the position of the turnover magnitude (long-dashed horizontal black line) are also shown.
Current usage metrics show cumulative count of Article Views (full-text article views including HTML views, PDF and ePub downloads, according to the available data) and Abstracts Views on Vision4Press platform.
Data correspond to usage on the plateform after 2015. The current usage metrics is available 48-96 hours after online publication and is updated daily on week days.
Initial download of the metrics may take a while.