Fig. 5
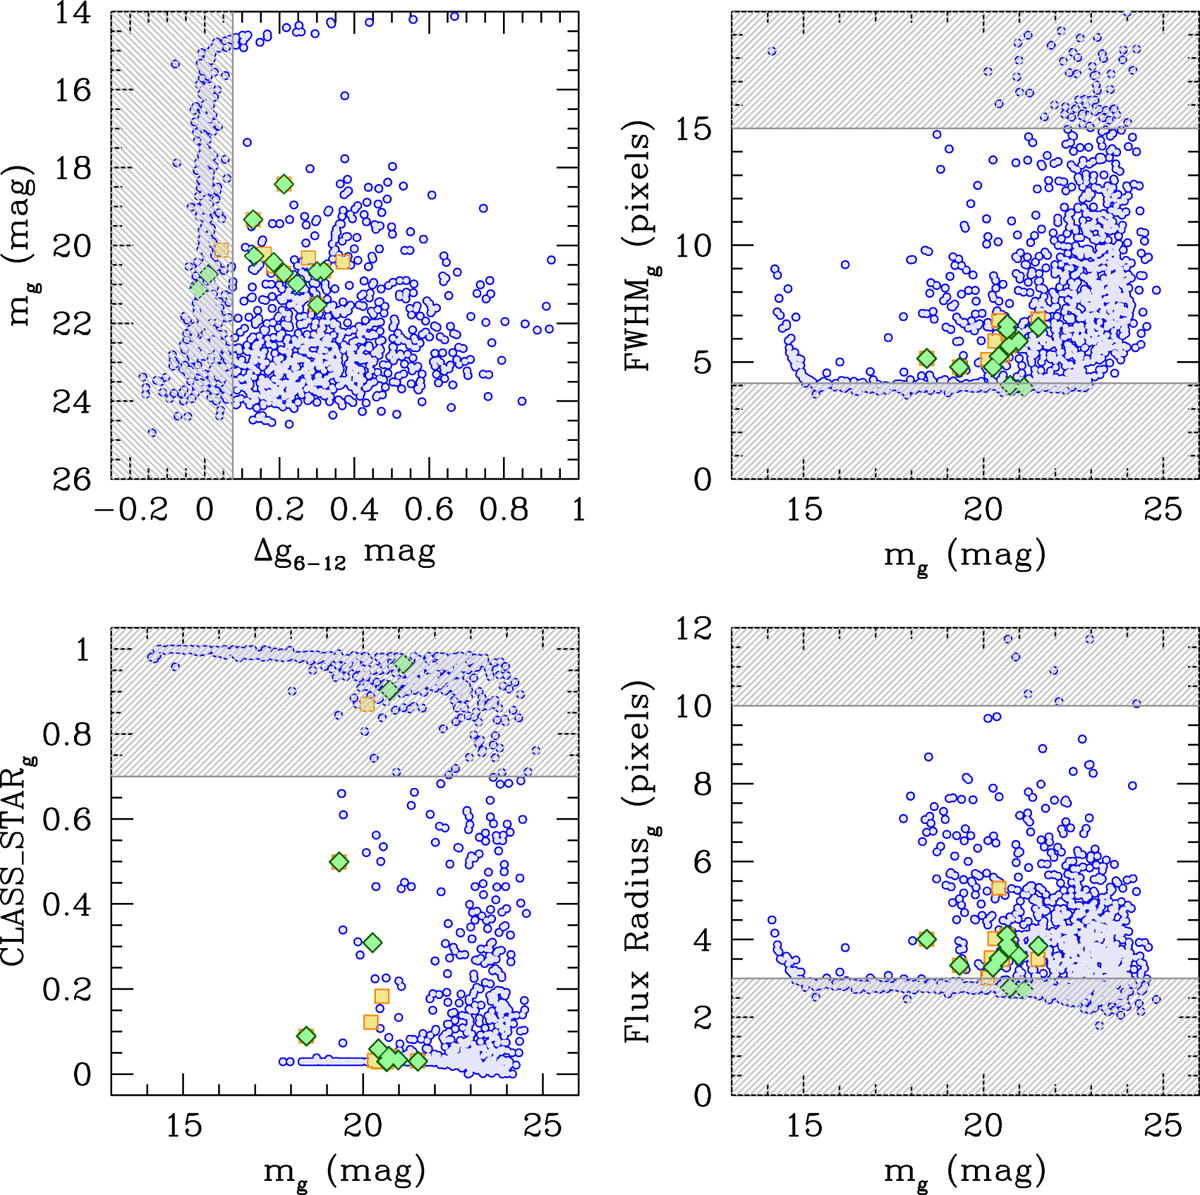
Upper left: g-band magnitude concentration index for the sample of color-selected GC candidates, shown in blue. As in Fig. 4, yellow squares and green diamonds indicate the location of Beasley & Sharples (2000) and Olsen et al. (2004) spectroscopic confirmedGCs, respectively. The gray shaded area defines the region in which sources are rejected as reliable GC candidates. Upper right: g-band FWHM from SExtractor vs. magnitude. Symbols are as upper left panel. Lower left: as upper right, but SExtractor CLASS_STAR parameter is plotted instead of FWHM. Lower right: as upper right, but SExtractor Flux Radius (i.e., half-light radius) parameter is plotted instead of FWHM. The saturation that is manifested as the rightward tail at bright magnitudes in the upper left panel, similar to the tail that points upward in the upper right and lower right panels, appears at a magnitude brighter than the brightest GCs (e.g., mg < 15.5 mag; see also Table 2), and therefore does not affect our GC candidate selection process.
Current usage metrics show cumulative count of Article Views (full-text article views including HTML views, PDF and ePub downloads, according to the available data) and Abstracts Views on Vision4Press platform.
Data correspond to usage on the plateform after 2015. The current usage metrics is available 48-96 hours after online publication and is updated daily on week days.
Initial download of the metrics may take a while.