Fig. 4
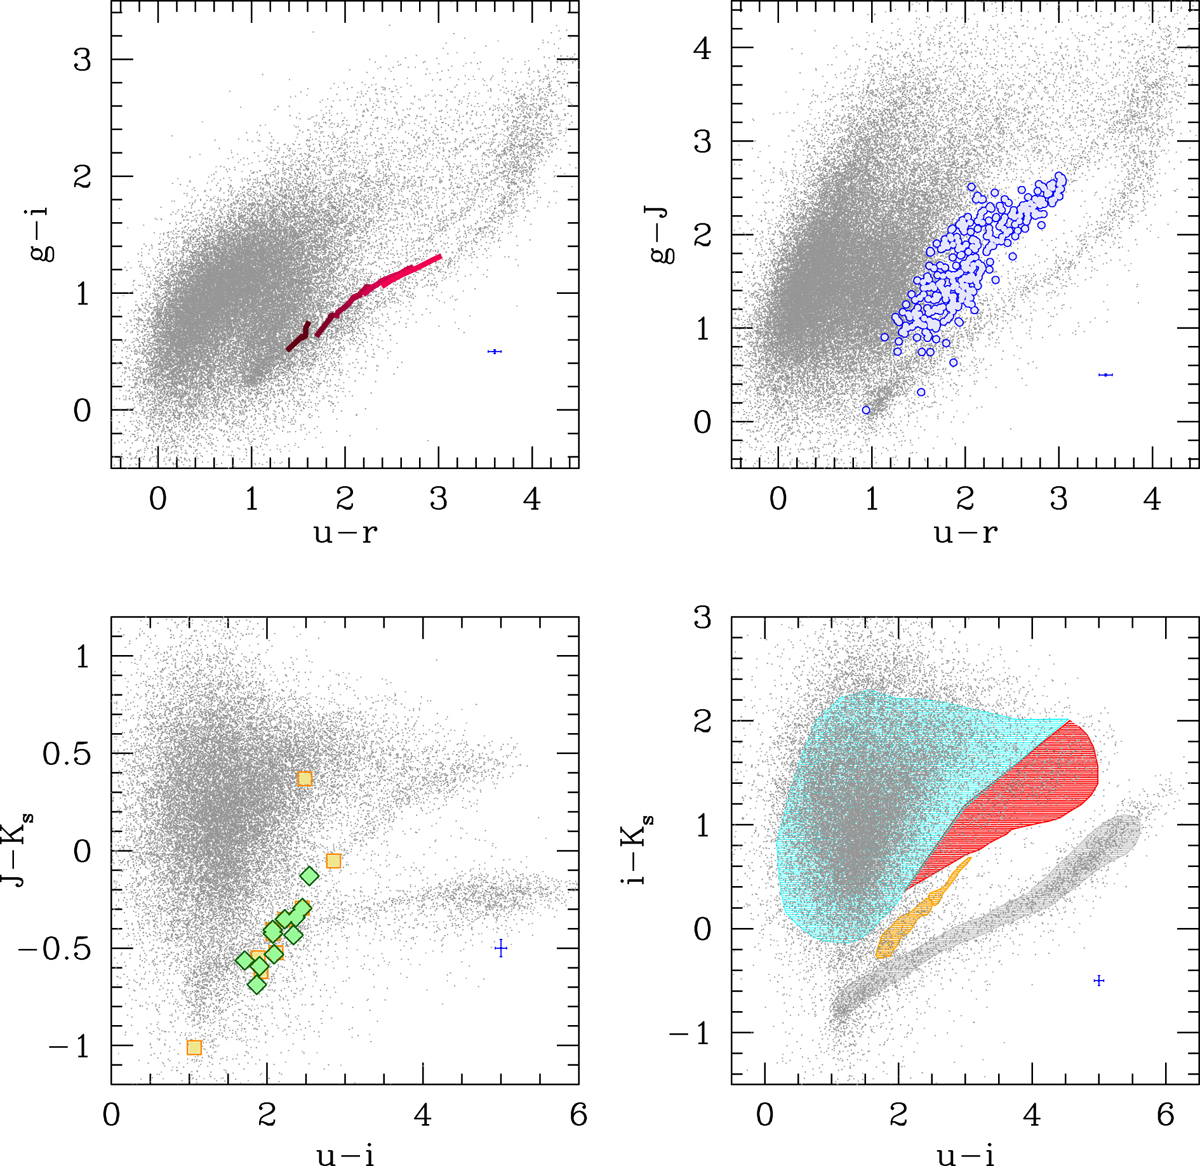
Selection of color–color diagrams used for selecting GC candidates. Gray dots show the full sample of matched sources. In each panel, in addition to the full sample, single elements of the GC selection process are highlighted. Upper left panel: SSP models for ages between 6 and 14 Gyr and [Fe∕H] between −2.3 and +0.3 are plotted with solid lines in various shades of red (darker for more metal-poor; at fixed [Fe∕H], older ages have redder colors). Upper right: blue dots show the sample of ∼ 350 GC candidates selected using color–color, photometric, and morphometric selection criteria described in text. The median error bars are indicated (lower right blue symbols), calculated as the sample median from GC candidates and shown in other panels as well. Lower left panel: yellow squares and green diamonds indicate the location of Beasley & Sharples (2000) and Olsen et al. (2004) spectroscopically confirmed GCs. Lower right panel: we highlight the approximate MW stars sequence (gray), the area occupied by background galaxies (passive in red and blue star-forming galaxies in cyan; see also Appendix A), and the area identified by Muñoz et al. (2014) as the locus of GCs (orange).
Current usage metrics show cumulative count of Article Views (full-text article views including HTML views, PDF and ePub downloads, according to the available data) and Abstracts Views on Vision4Press platform.
Data correspond to usage on the plateform after 2015. The current usage metrics is available 48-96 hours after online publication and is updated daily on week days.
Initial download of the metrics may take a while.