Free Access
Fig. 3
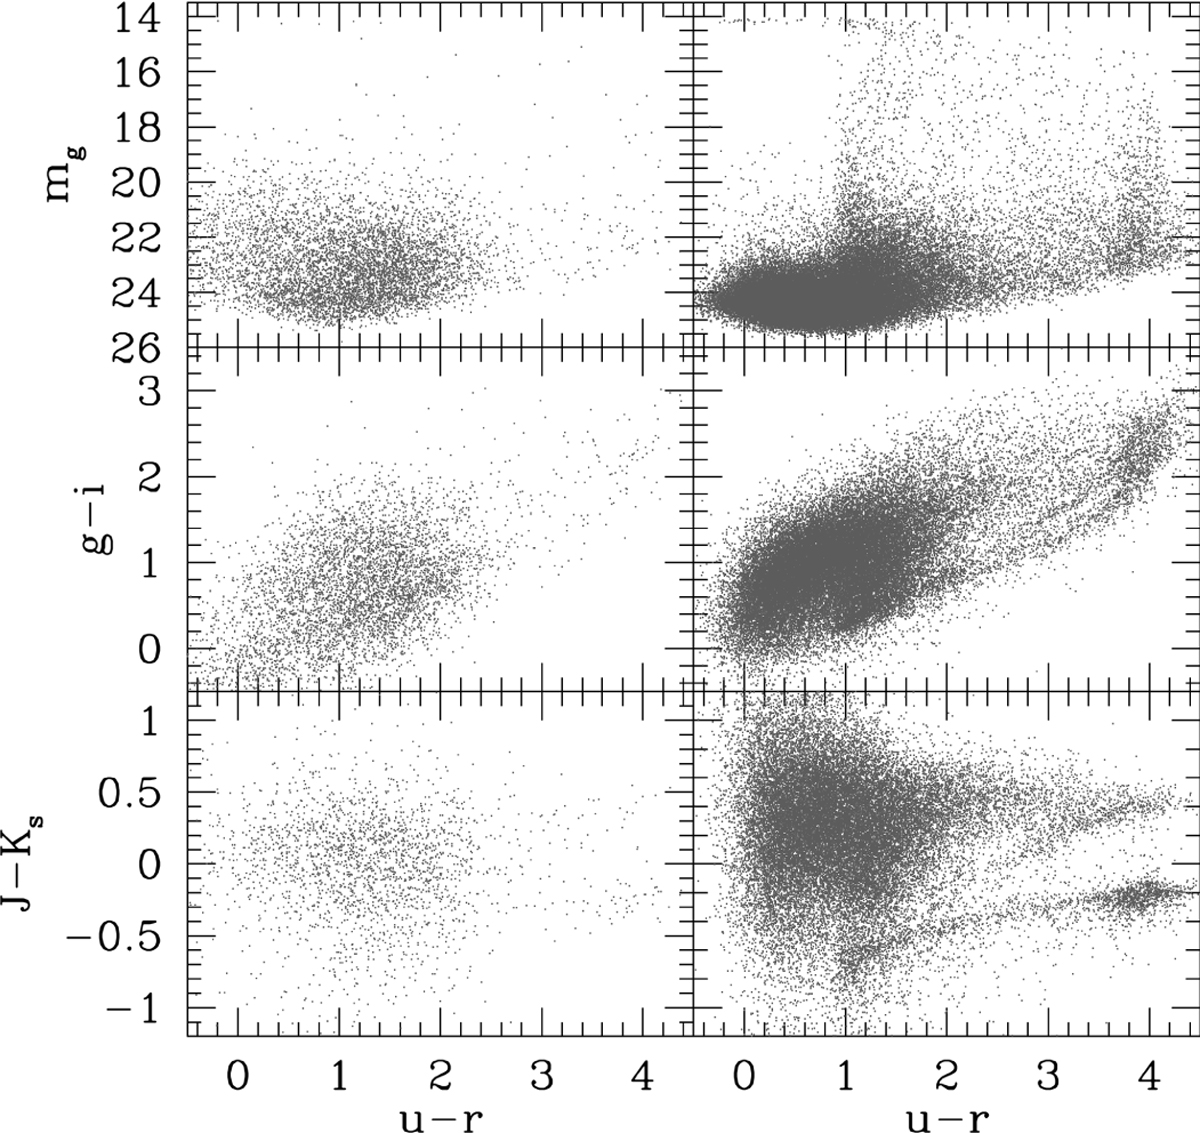
Color magnitude and color–color diagrams for the full matched catalog of sources detected. Left panels: sources detected at galactocentric radii with moderate-to-high galaxy surface brightness background, μg ≤ 23.6 mag/arcsec2, are shown. Right panels: sources detected in regions with low galaxy background are shown.
Current usage metrics show cumulative count of Article Views (full-text article views including HTML views, PDF and ePub downloads, according to the available data) and Abstracts Views on Vision4Press platform.
Data correspond to usage on the plateform after 2015. The current usage metrics is available 48-96 hours after online publication and is updated daily on week days.
Initial download of the metrics may take a while.