Free Access
Fig. 14
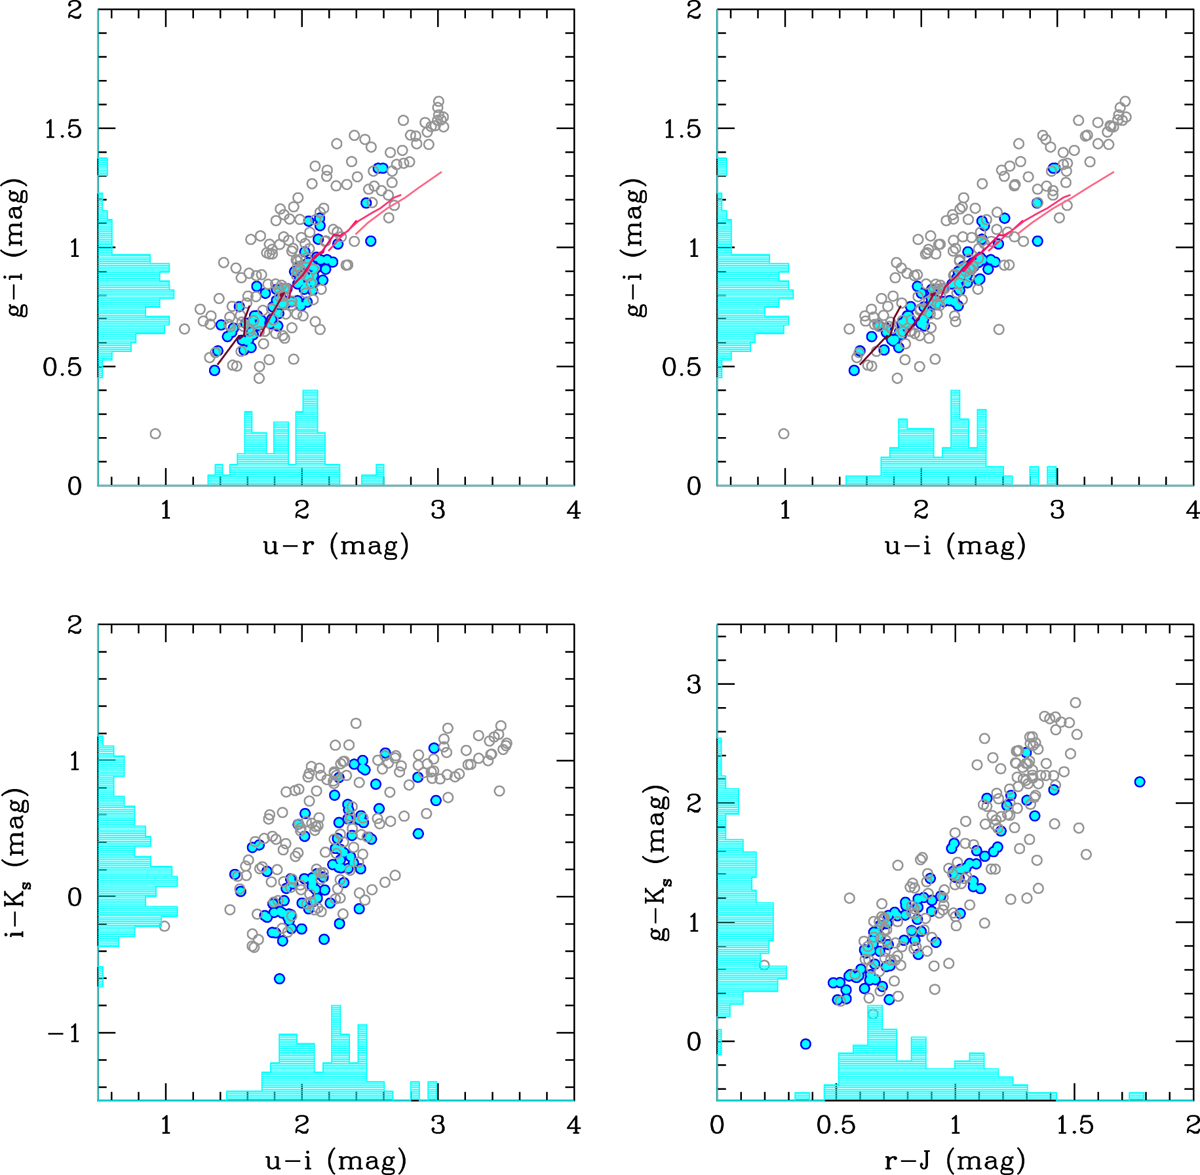
Color–color diagrams for the bona fide and uncertain samples of GCs, shown with blue filled dots and empty graycircles, respectively. The (arbitrarily scaled) histograms reported on the axes refer to the bona fide sample. For optical colors, the SPoT SSP models are also shown with lines as in Fig. 4.
Current usage metrics show cumulative count of Article Views (full-text article views including HTML views, PDF and ePub downloads, according to the available data) and Abstracts Views on Vision4Press platform.
Data correspond to usage on the plateform after 2015. The current usage metrics is available 48-96 hours after online publication and is updated daily on week days.
Initial download of the metrics may take a while.