Free Access
Fig. 1
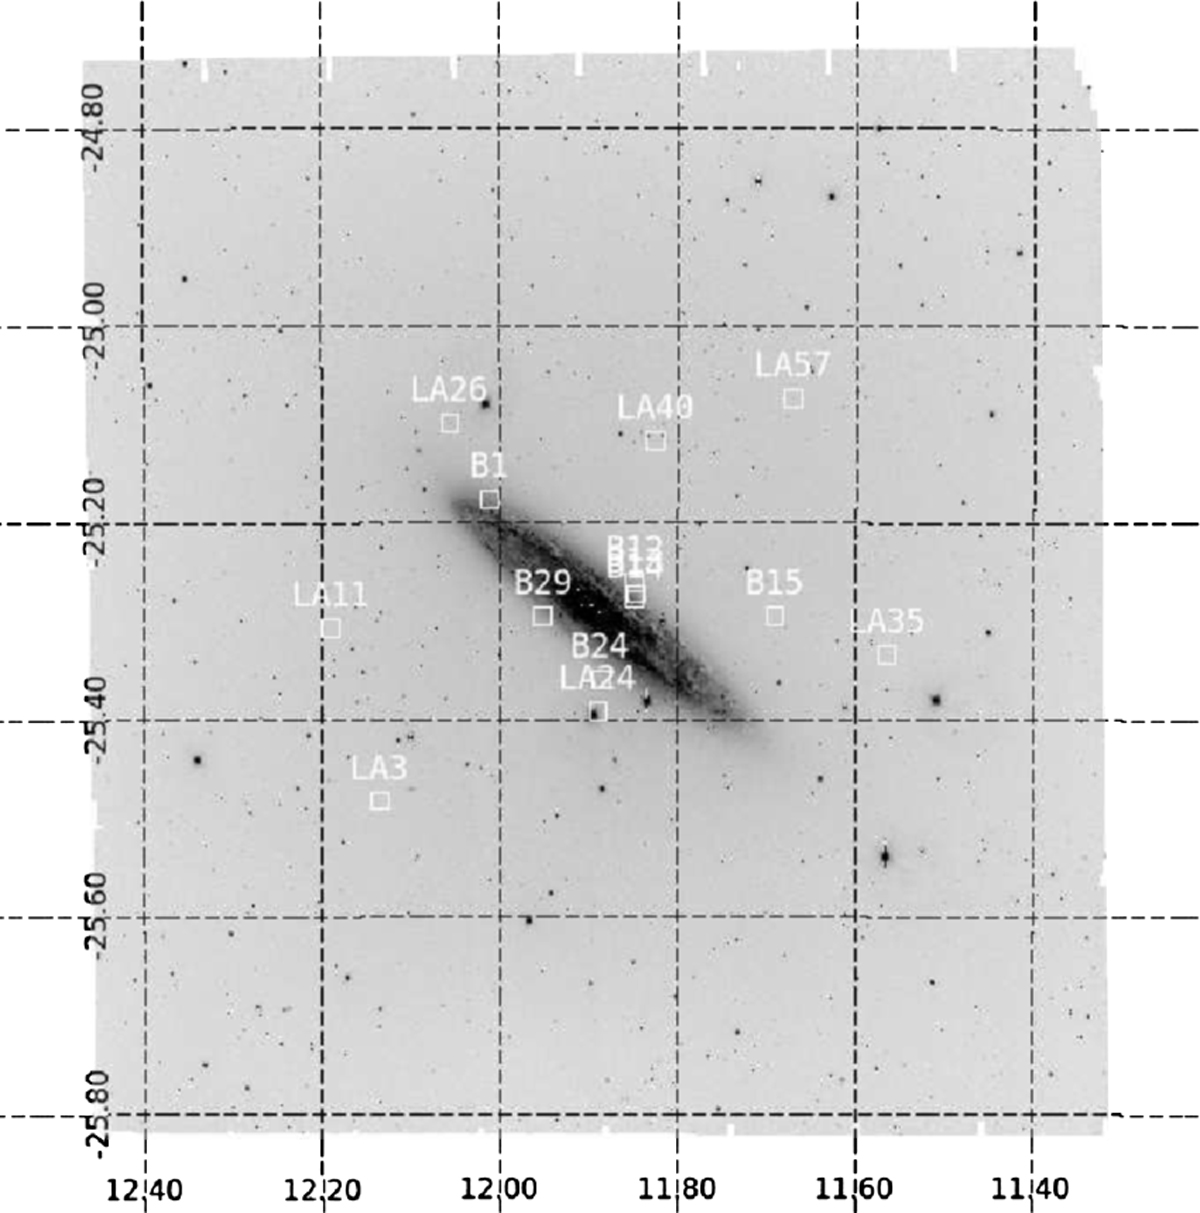
Full field of view observed with VST (g band is shown, other bands are nearly identical). White squares indicate the 14 spectroscopic confirmed GCs from Beasley & Sharples (2000), labeled as in Table 2 (Col. 6) in that paper.
Current usage metrics show cumulative count of Article Views (full-text article views including HTML views, PDF and ePub downloads, according to the available data) and Abstracts Views on Vision4Press platform.
Data correspond to usage on the plateform after 2015. The current usage metrics is available 48-96 hours after online publication and is updated daily on week days.
Initial download of the metrics may take a while.