Fig. 4
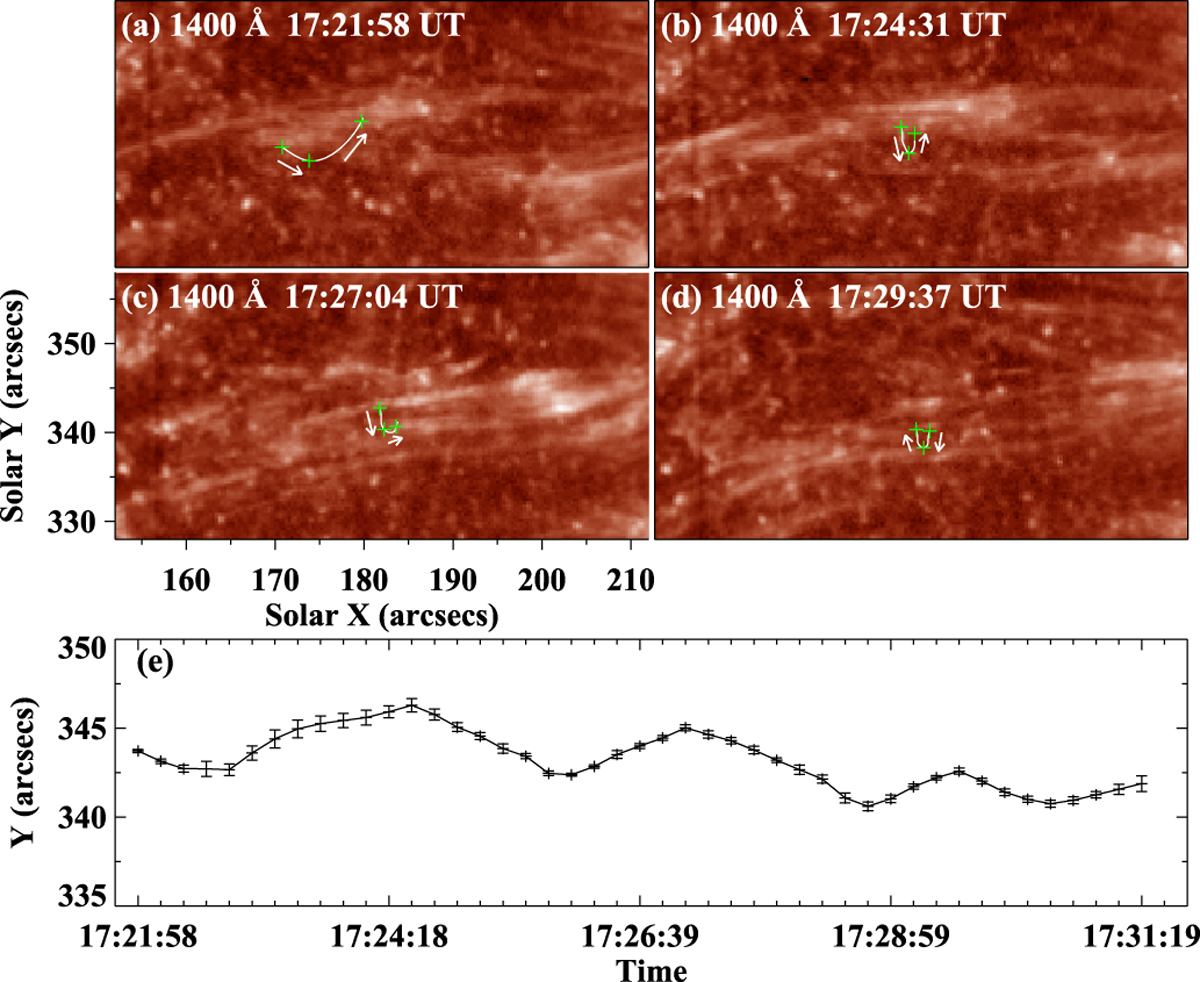
Panels a–d: sequence of IRIS 1400 Å images showing the development of the transverse oscillation from 17:21:58 UTto 17:31:19 UT. The green pluses and white lines approximate the track of the loop’s oscillation, and the white arrows indicate the moving directions of the tracked material. The FOV of these panels has been outlined by the blue dashed rectangle in Fig. 3a. Panel e: the evolution of the tracking loop’s transverse position during the oscillation. The full temporal evolution of the oscillation in 1400 Å is available as an online animation.
Current usage metrics show cumulative count of Article Views (full-text article views including HTML views, PDF and ePub downloads, according to the available data) and Abstracts Views on Vision4Press platform.
Data correspond to usage on the plateform after 2015. The current usage metrics is available 48-96 hours after online publication and is updated daily on week days.
Initial download of the metrics may take a while.