Fig. 3
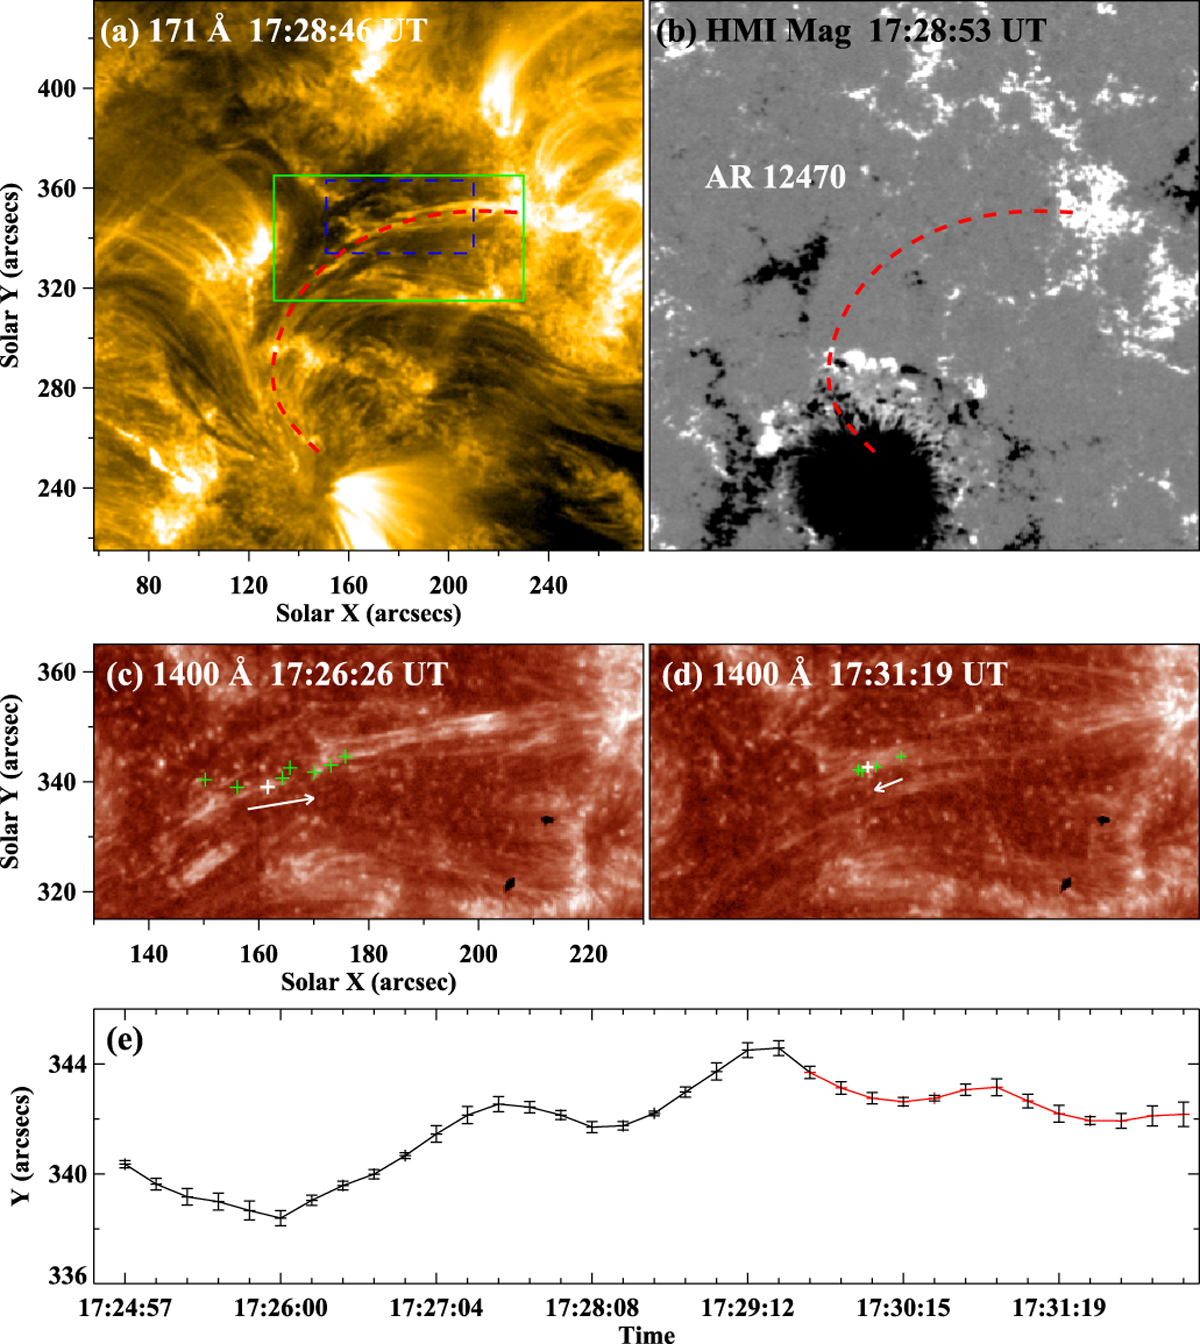
Panels a–b: SDO/AIA 171 Å image and SDO/HMI LOS magnetogram showing the EUV loops of the focused region on 2015 December 19 and its underneath magnetic fields. The red dashed lines delineate the magnetic loops along which the wave propagates. The green solid rectangle in panel a outlines the FOV of panels c–d while the blue dashed rectangle represents the FOV of 1400 Å and 171 Å images in Figs. 4 and 5. Panels c–d: IRIS SJIs of 1400 Å displaying the propagation of the wave. The white arrows denote the propagating directions of the wave by tracking a bright spot. The green pluses outline the trajectory of the bright spot from 17:24:57 UT to 17:32:23 UT and the white pluses mask the positions of the spot at the moments shown in panels c and d. Panel e: the evolution of the spot’s transverse position during the propagation of the wave. The black curve shows the wave propagating to the right (panel c) while the red to the left (panel d). An animation of the 1400 Å images is available online.
Current usage metrics show cumulative count of Article Views (full-text article views including HTML views, PDF and ePub downloads, according to the available data) and Abstracts Views on Vision4Press platform.
Data correspond to usage on the plateform after 2015. The current usage metrics is available 48-96 hours after online publication and is updated daily on week days.
Initial download of the metrics may take a while.