Fig. 2
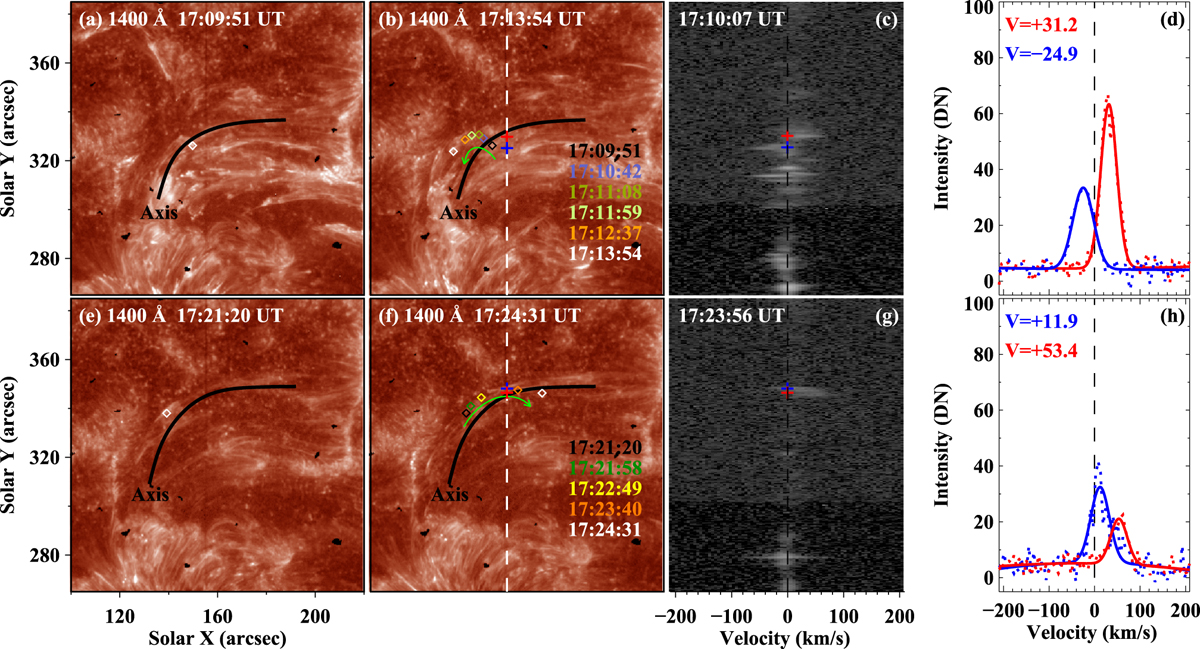
Panels a–b: IRIS SJIs of 1400 Å displaying the first rotation motion around 17:10 UT on 2015 December 19. The black line approximates the axis of the rotation while the green arrow marks the direction of the rotation. The positions of the tracked feature in different times are denoted by diamonds of different colors, of which the white one represents the current position. The white dashed line in panel b shows the location of slit. Panels c–d: Si IV 1402.77 Å line spectra along the slit in panel b and the profiles (dotted lines) and its Gaussian fittings (solid lines) of this line at blue and red plus positions in panels b and c. The observation time is at 17:10:07 UT. Panels e–f : IRIS 1400 Å images exhibiting the second rotation motion of the loops just before the appearance of a propagating wave. The features marked here are similar to those in panels a–b. Panels g–h: similar to panels c–d, but at 17:23:56 UT. The temporal evolution of the two rotation motions is available as an online animation.
Current usage metrics show cumulative count of Article Views (full-text article views including HTML views, PDF and ePub downloads, according to the available data) and Abstracts Views on Vision4Press platform.
Data correspond to usage on the plateform after 2015. The current usage metrics is available 48-96 hours after online publication and is updated daily on week days.
Initial download of the metrics may take a while.