Fig. 1
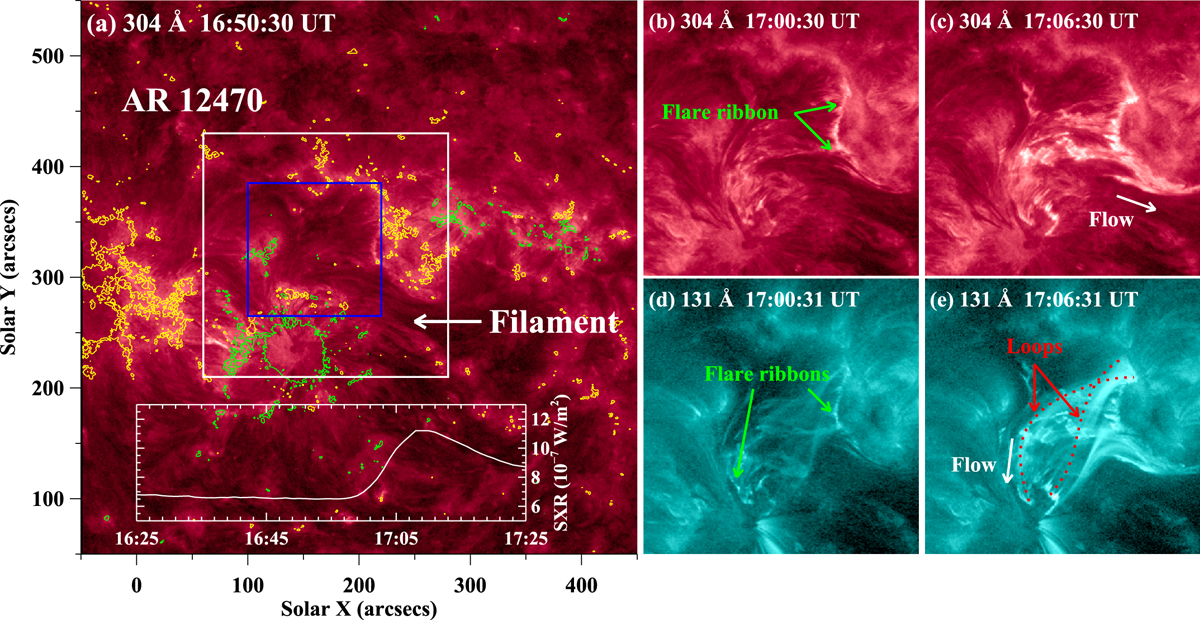
Panel a: SDO/AIA 304 Å image displaying the overview of the NOAA AR 12470 on 2015 December 19. The filament before activation is denoted by the white arrow. The white square outlines the field of view (FOV) of panels b–e while the blue square represents the FOV of 1400 Å images in Fig. 2. The green and yellow curves are contours of corresponding negative and positive magnetic fields, respectively. The white curve in the bottom shows GOES SXR 1–8 Å flux of the associated C1.1 flare. Panels b–e: sequence of AIA 304 Å and 131 Å images showing the flare caused by the filament’s activation in two different temperatures. The green arrows in panels b and d mark the flare ribbons while the white arrows in panels c and e approximate the trajectory of the filament material flows. The red dotted lines in panel e indicate the flare loops with shear in high temperature. An animation of the 131 Å and 304 Å images is available online.
Current usage metrics show cumulative count of Article Views (full-text article views including HTML views, PDF and ePub downloads, according to the available data) and Abstracts Views on Vision4Press platform.
Data correspond to usage on the plateform after 2015. The current usage metrics is available 48-96 hours after online publication and is updated daily on week days.
Initial download of the metrics may take a while.