Free Access
Fig. 9
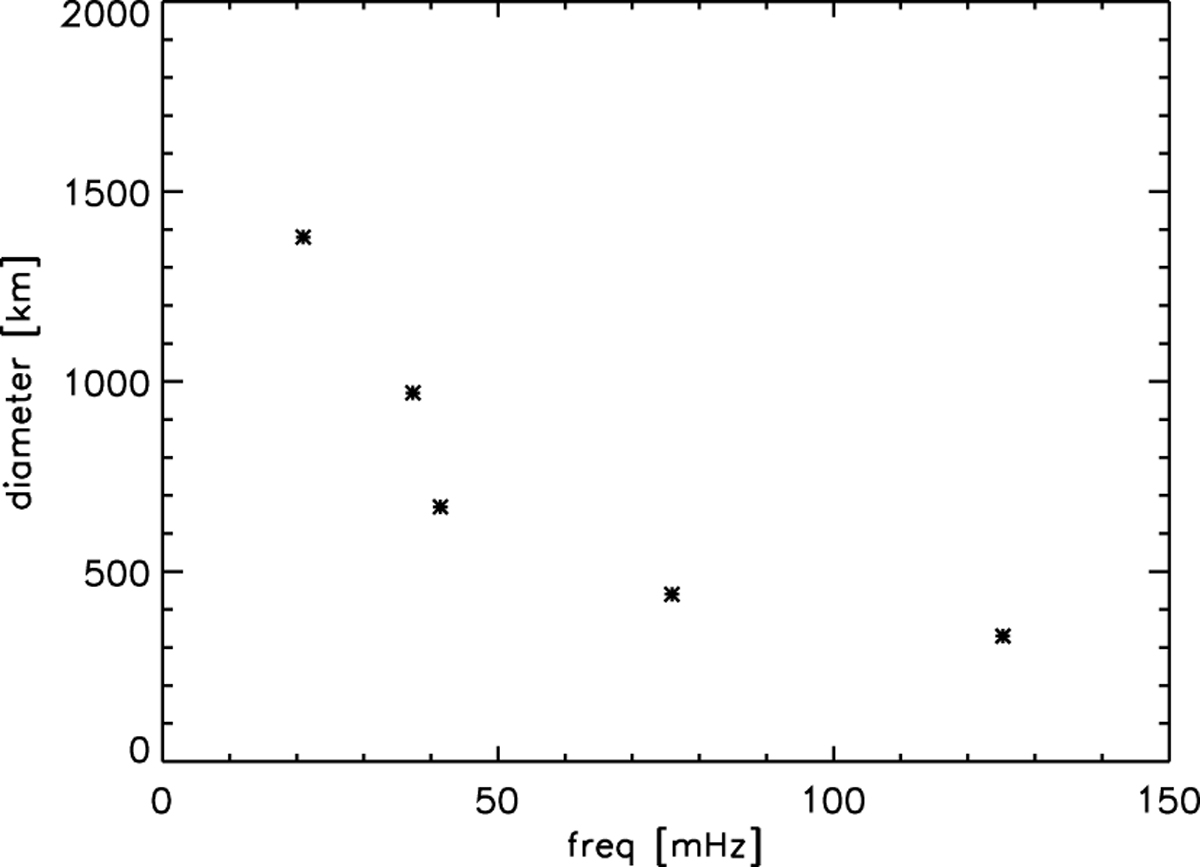
Frequency dependence with the diameter of the cavity (β = 1 contour) for the set of simulations carried out with different magnetic field strengths. The selected point is located in the low beta region close to the null point (see the blue dots in Fig. 1).
Current usage metrics show cumulative count of Article Views (full-text article views including HTML views, PDF and ePub downloads, according to the available data) and Abstracts Views on Vision4Press platform.
Data correspond to usage on the plateform after 2015. The current usage metrics is available 48-96 hours after online publication and is updated daily on week days.
Initial download of the metrics may take a while.