Fig. 8
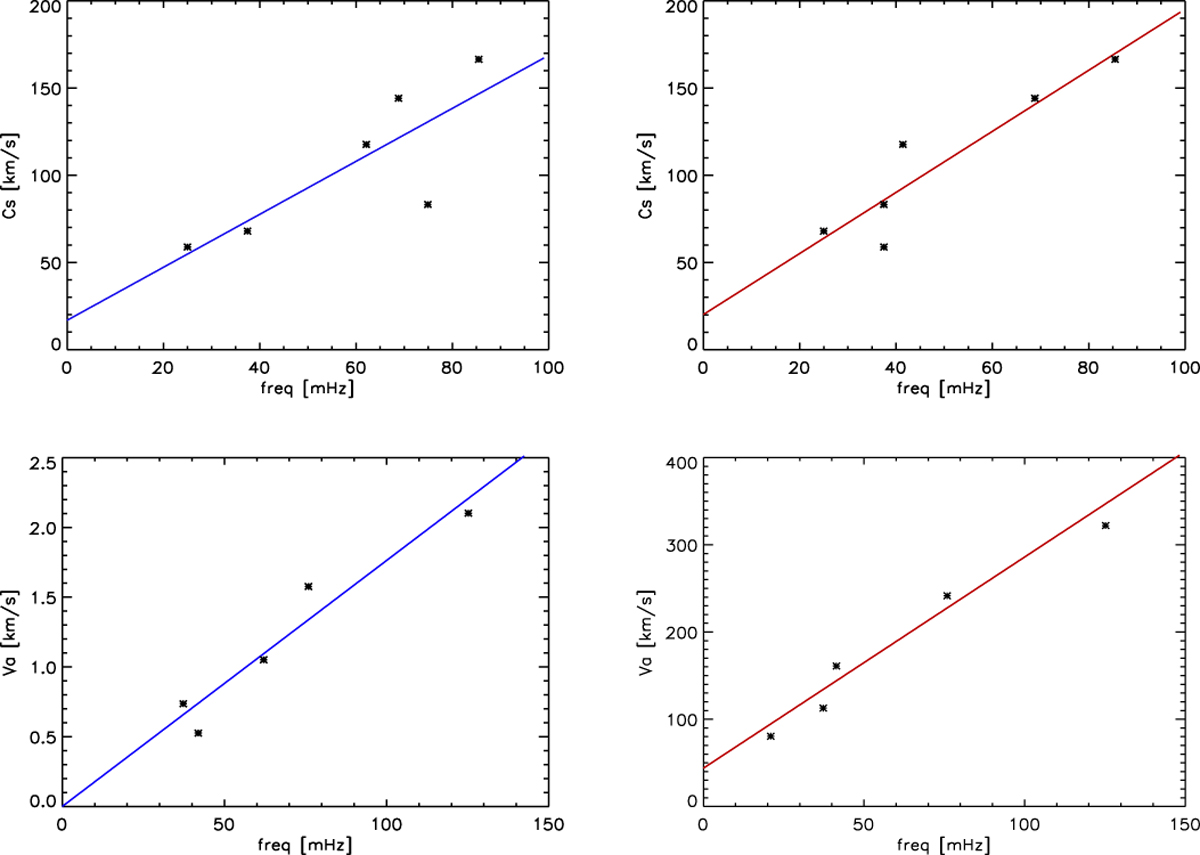
Frequency dependence with the sound speed (top panels) and Alfvén speed (bottom panels) for the sets of simulations carried out with different Alfvén and sound speeds. The overplotted lines are the linear fits of the points obtained from the simulations. The left-hand panels correspond to a point inside the high β region around the null point, while the right-hand panels correspond to a selected point in the low beta region close to the null point (see the blue dots in Fig. 1).
Current usage metrics show cumulative count of Article Views (full-text article views including HTML views, PDF and ePub downloads, according to the available data) and Abstracts Views on Vision4Press platform.
Data correspond to usage on the plateform after 2015. The current usage metrics is available 48-96 hours after online publication and is updated daily on week days.
Initial download of the metrics may take a while.